A New Era of Earth Observation from the ISS

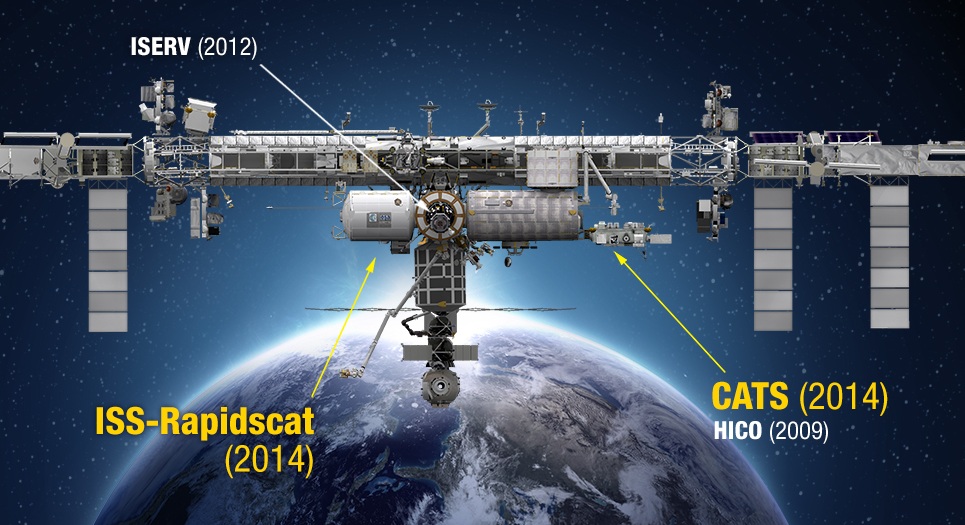
“Off the Earth, for the Earth” is NASA’s tagline for the International Space Station (ISS) and with the launch of additional earth observation instruments later this month, NASA is all set to kick off what it is calling “The new era of Earth Science from Space Station”.

ISS

A total of 6 instruments are to be mounted on the station to help study our planet. The first set of instruments are scheduled for launch later this year and the rest of the instruments will be launched in 2016.

Normally, these instruments would have been part of a satellite mission but the ISS has a few advantages in that regard. The ISS orbit provides a longer observation time over forests and vegetation than possible with the polar orbit commonly used for Earth observations missions. In addition, limitation due to power resources are also much lesser as the ISS has sufficient power. Here’s a short overview regarding the instruments and their purposes:

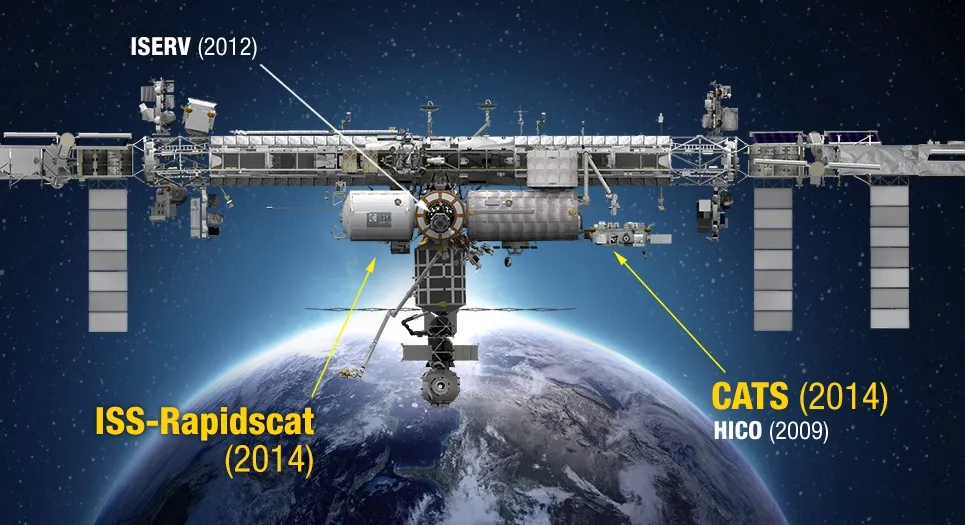
ISS-Rapidscat will be scheduled for launch after 19th of this month on the next SpaceX Commercial Resupply Services flight scheduled for the ISS. The instrument will monitor ocean winds and hurricanes from the space station.

The Cloud-Aerosol Transport System (CATS) will be the second instrument to take off for the ISS and is scheduled to do so on another SpaceX Resupply mission scheduled for December. The CATS is a laser instrument that will measure clouds, the location and distribution of airborne particles such as pollution, mineral dust, smoke, and other particulates in the atmosphere.

The Stratospheric Aerosol and Gas Experiment III (SAGE III), will help measure aerosols, ozone, water vapor and other gases in the upper atmosphere to help scientists assess how the ozone layer is recovering and better understand global climate change.

The Lightning Imaging Sensor (LIS) is actually not something new. It was first launched in 1997 as part of a NASA’s Tropical Rainfall measurement mission. It will monitor lightning for Earth science studies and provide cross-sensor calibration and validation with other space-borne instruments and ground-based lightning networks.

The Global Ecosystem Dynamics Investigation (GEDI) will study the forests in 3D. It uses a laser-based system to study forest canopy structure in a range of ecosystems and different latitudes. The primary objective is to help better understand the changes in carbon storage within forests from both human activities and natural climate variations.

The ECOsystem Spaceborne Thermal Radiometer Experiment on Space Station (ECOSTRESS) is a high-resolution,  multi-spectral thermal imaging spectrometer that will help study water use and water stress in vegetation The objective is to understand the link between water cycle and plant health and also understand how ecosystems handle changes in climate.

With the launch of these instruments, the ISS will join a fleet of 17 NASA Earth Observation missions that are currently providing data on the dynamic and complex planet that we call home.


Did you like this post about ISS? Read more and subscribe to our monthly newsletter!

Say thanks for this article (0)
The community is supported by:
Become a sponsor
#
#Construction #Featured #Real Estate #Transportation
Urban Planning’s New Frontier: The Transformative Power of Satellite Imagery
Avatar for Barry Morisse
Barry Morisse 11.14.2024
AWESOME 1
#Business #Environment #Featured #Shipping #Transportation
Achieving Ambitious Climate Goals How Can Marine Geospatial Data Protect Our Oceans While Supporting the Shipping Industry
Nikita Marwaha Kraetzig 11.14.2024
AWESOME 1
#Agriculture #Business #Construction #Data processing #Energy #Environmental Protection #ESG #Financial Services #Geospatial analytics #Geospatial for Good #Government #Health Care #Military #Natural Resources #Real Estate #Transportation
Making Sense of Satellite Imagery: How Can We Process Data at Scale?
Avatar for Barry Morisse
Barry Morisse 05.13.2024
AWESOME 2
Next article

First InSAR deformation maps of Sentinel-1A from the recent Napa Valley earthquake

The earthquake
On 24 August 2014 North California was shaken by the most powerful earthquake of the past 25 years. The epicentre was located at a depth of around 11 kilometres in the middle of the Napa Valley, a wine growing area extending about 40km North of San Francisco. Fortunately, the 6.0 magnitude earthquake spared from fatal injuries but made houses collapse and roads mount up along lines, where the energy of tectonics directly released.

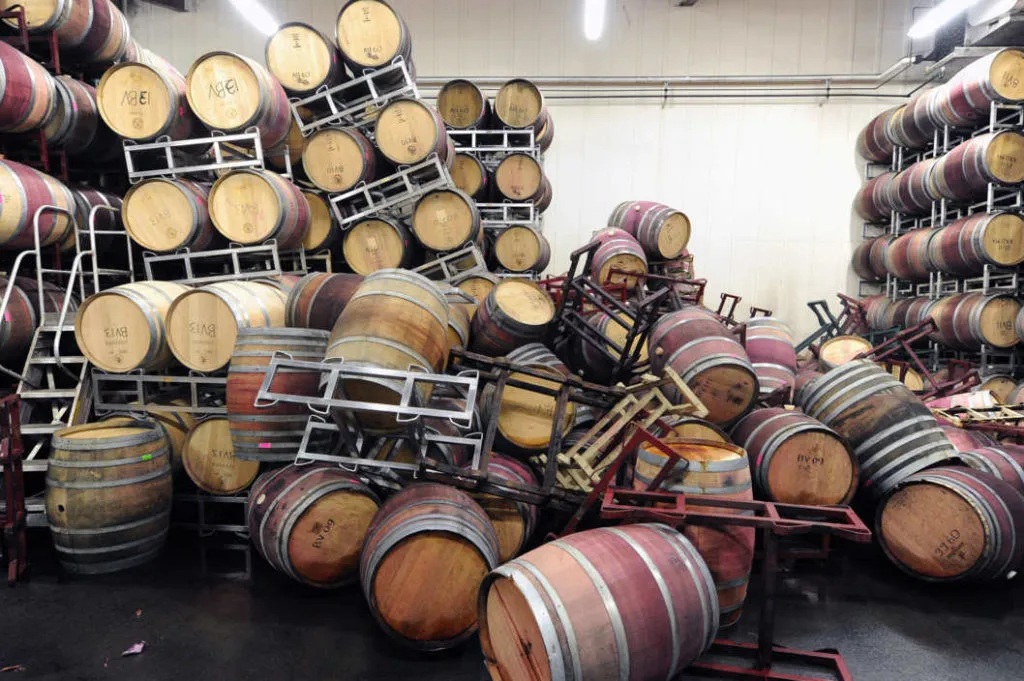
The earthquake caused considerable wine losses.

The earthquake caused considerable wine losses.

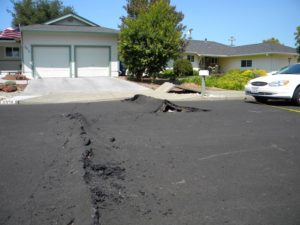
Fault damage in the suburbs West of Napa: The fault rupture ran through homes and across roads.

Fault damage in the suburbs West of Napa: The fault rupture ran through homes and across roads.

During earthquakes the earth’s surface is deformed. Radar technology from space has proofed to be an accurate method to measure this vertical movement of the crust. Synthetic aperture radar interferometry (InSAR) enables to calculate the distance between a satellite sensor (space borne in case of SAR) and the earth’s surface and thus to generate elevation models. Two images of the same area taken at different dates can be combined to detect small elevation changes over large areas.

Radar images
For the very recent Napa Valley earthquake radar images from ESA’s Sentinel-1A satellite were used to process a so called interferogram, which is the product of two interferometrically processed images: The first image was taken on 7 August 2014 on the same day when the satellite reached its operating orbit and the second one on 31 August after the earthquake had occurred. The technically and strategically pleasing news is that although Sentinel-1A, which was only launched on 3 April 2014 and is still being commissioned, ESA was able to specifically respond to the incident and provide data rapidly.

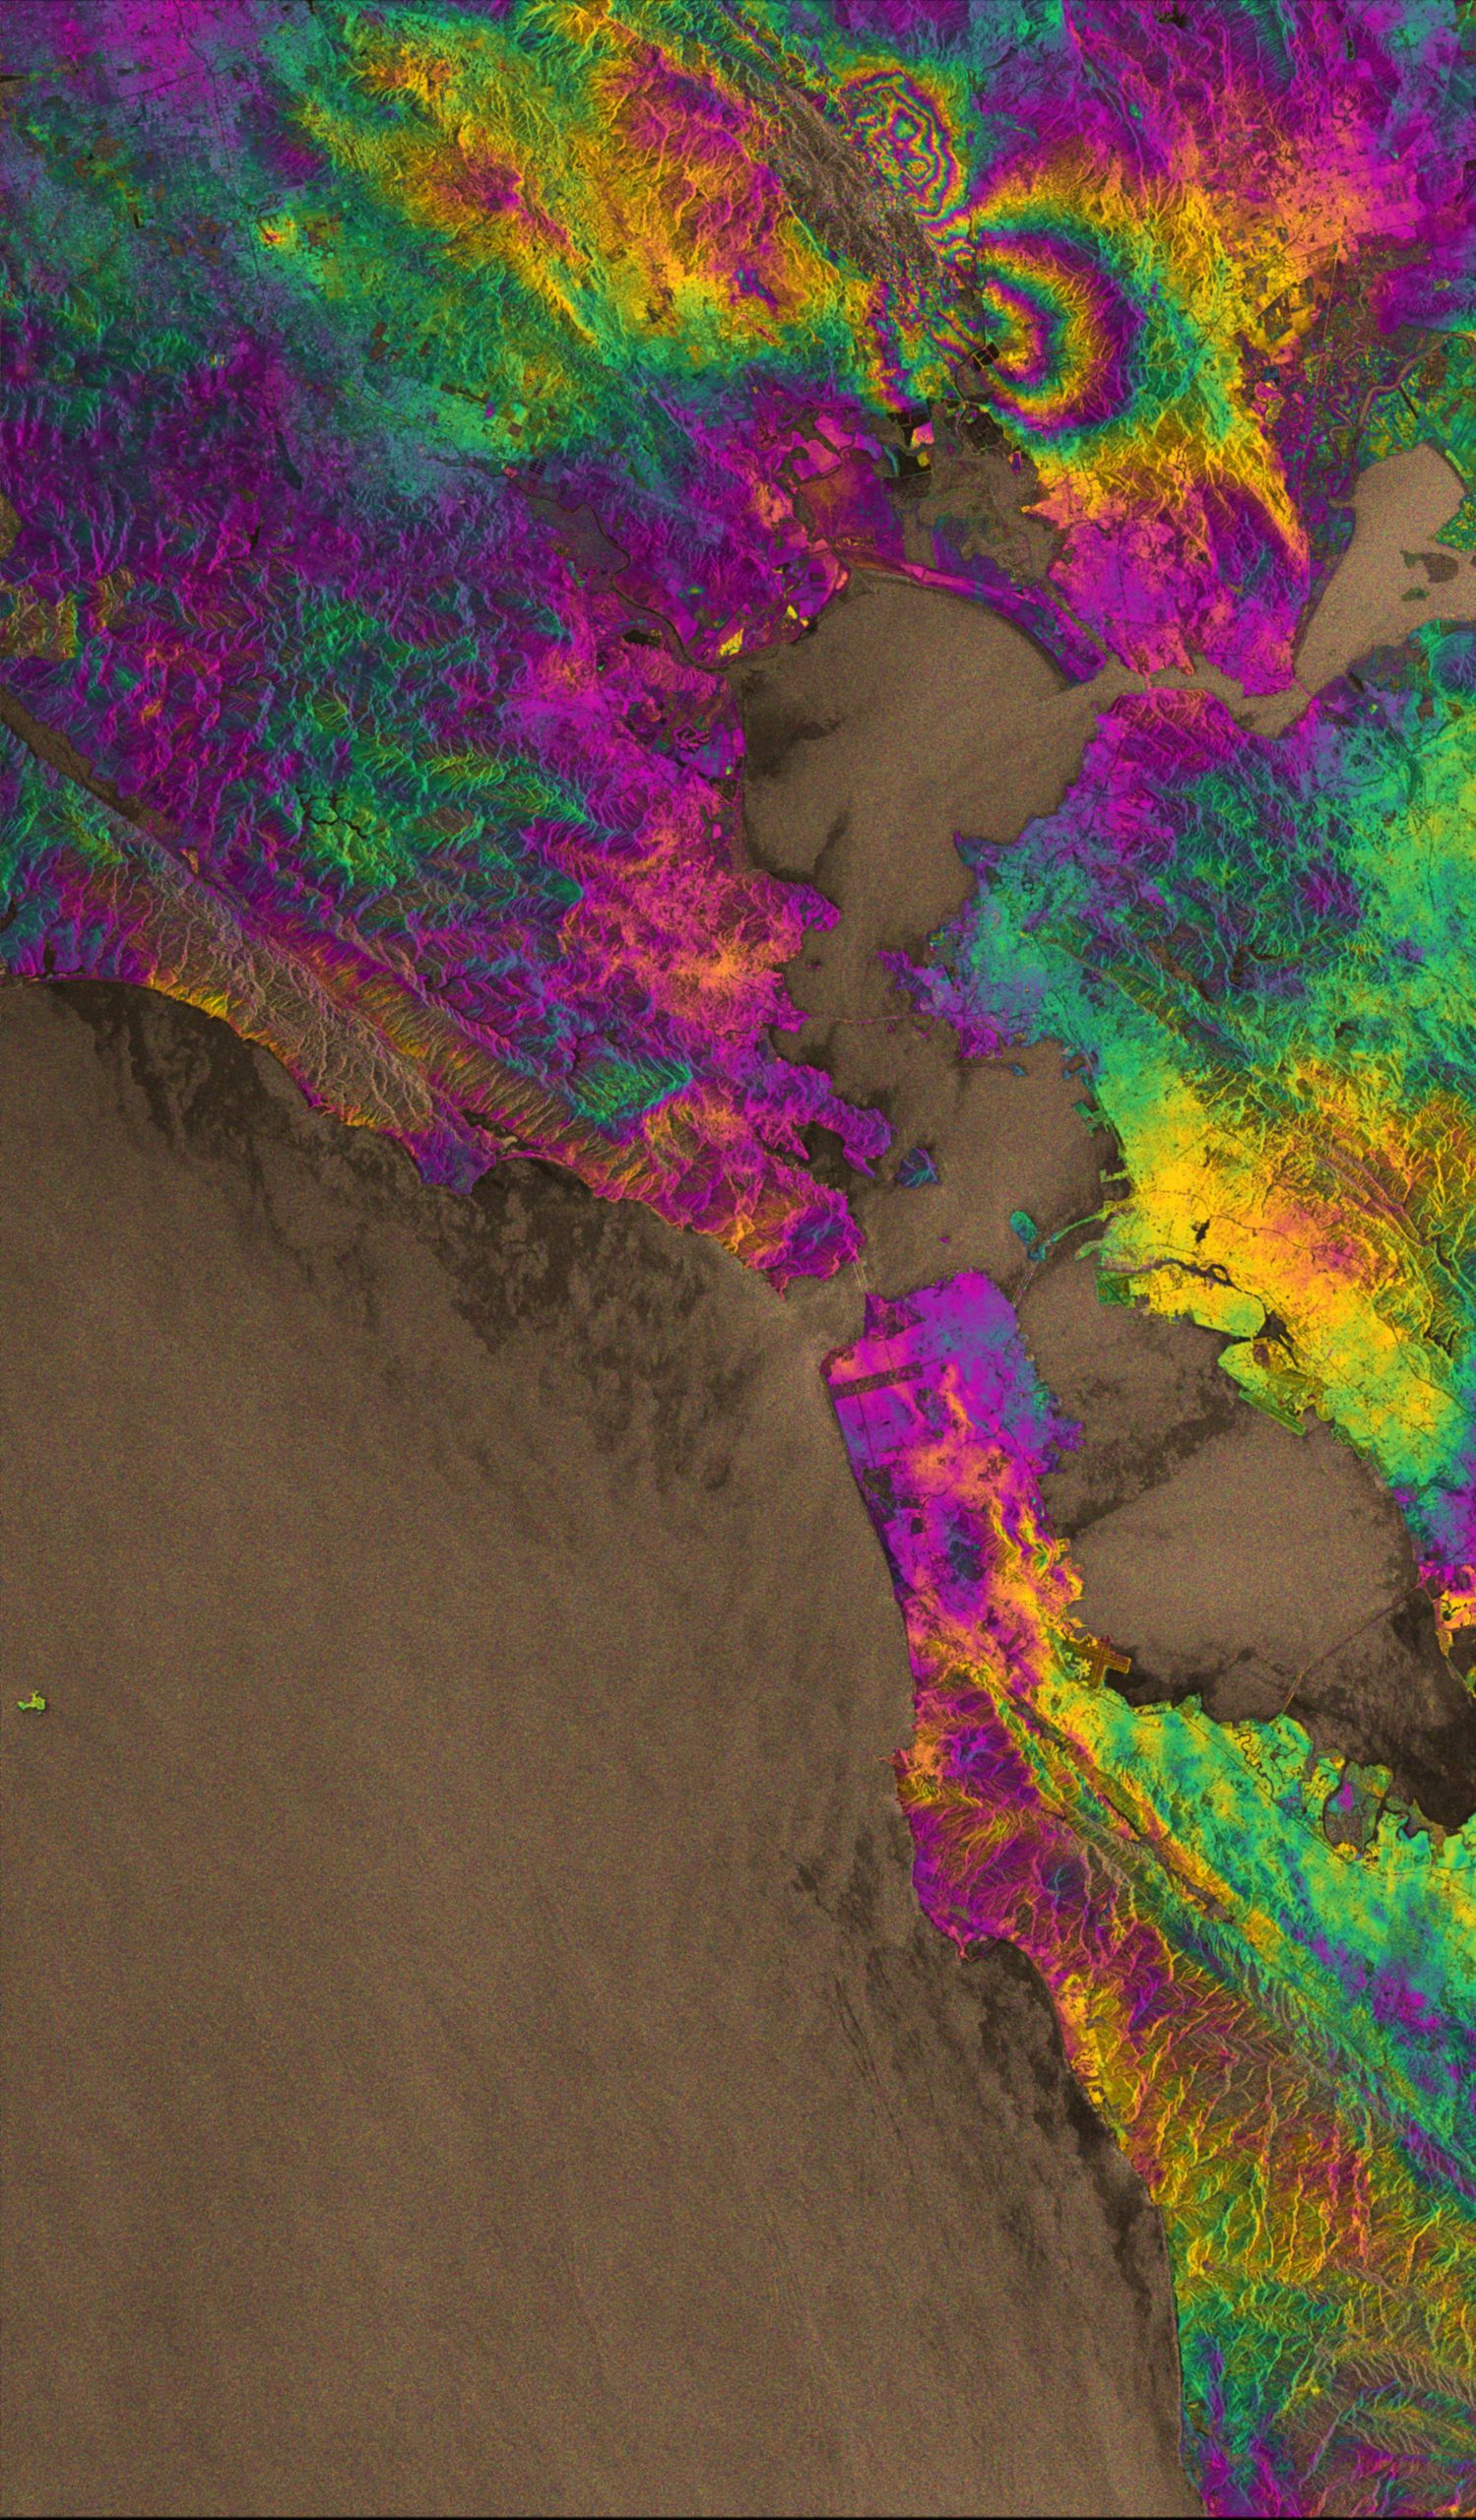
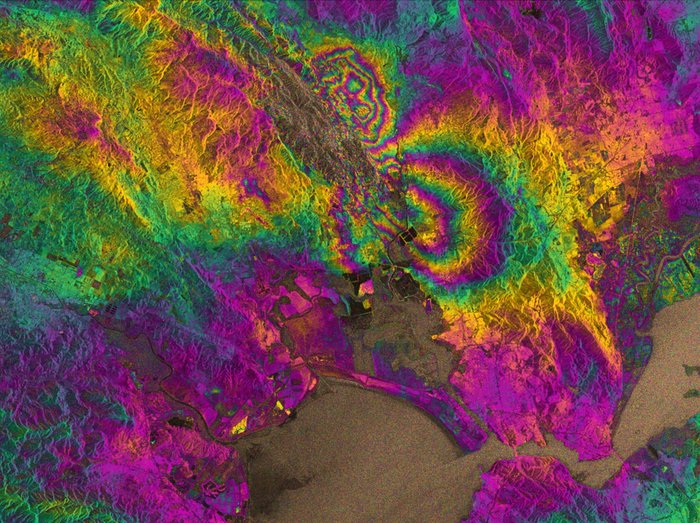
In the interferogram as shown below the topography is deducted in either image in order to only reveal the elevations changes that were caused by the earthquake. Coloured areas denote surfaces that were deformed during the earthquake, whereas one rainbow colour cycle (e.g. from red to red) refers to exactly 28mm vertical movement (wave length/2). Different colour lines lying tightly together indicate a greater deformation than plane fields of the same colouring. The direction of the deformation, if it was a lifting or sinking movement, has to be determined by a proper (separate) inspection. In the interferogram, the two circles with several rainbow sequences reveal the areas where most deformation occurred. The deformation within this zone is greater than 10 cm, whereas a territory of 30 x 30km was affected significantly. The figure reveals that the earthquake was caused by the Western Napa Fault system (very wide colour fields) pressing against the plate in the East and provoking its deformation.

InSAR deformation maps

InSAR deformation maps, Sentinel-1A interferogram of the ground deformation due to the August 24th earthquake, Napa, California. Source: ESA

InSAR deformation maps

Interferogram in detail. Source: ESA

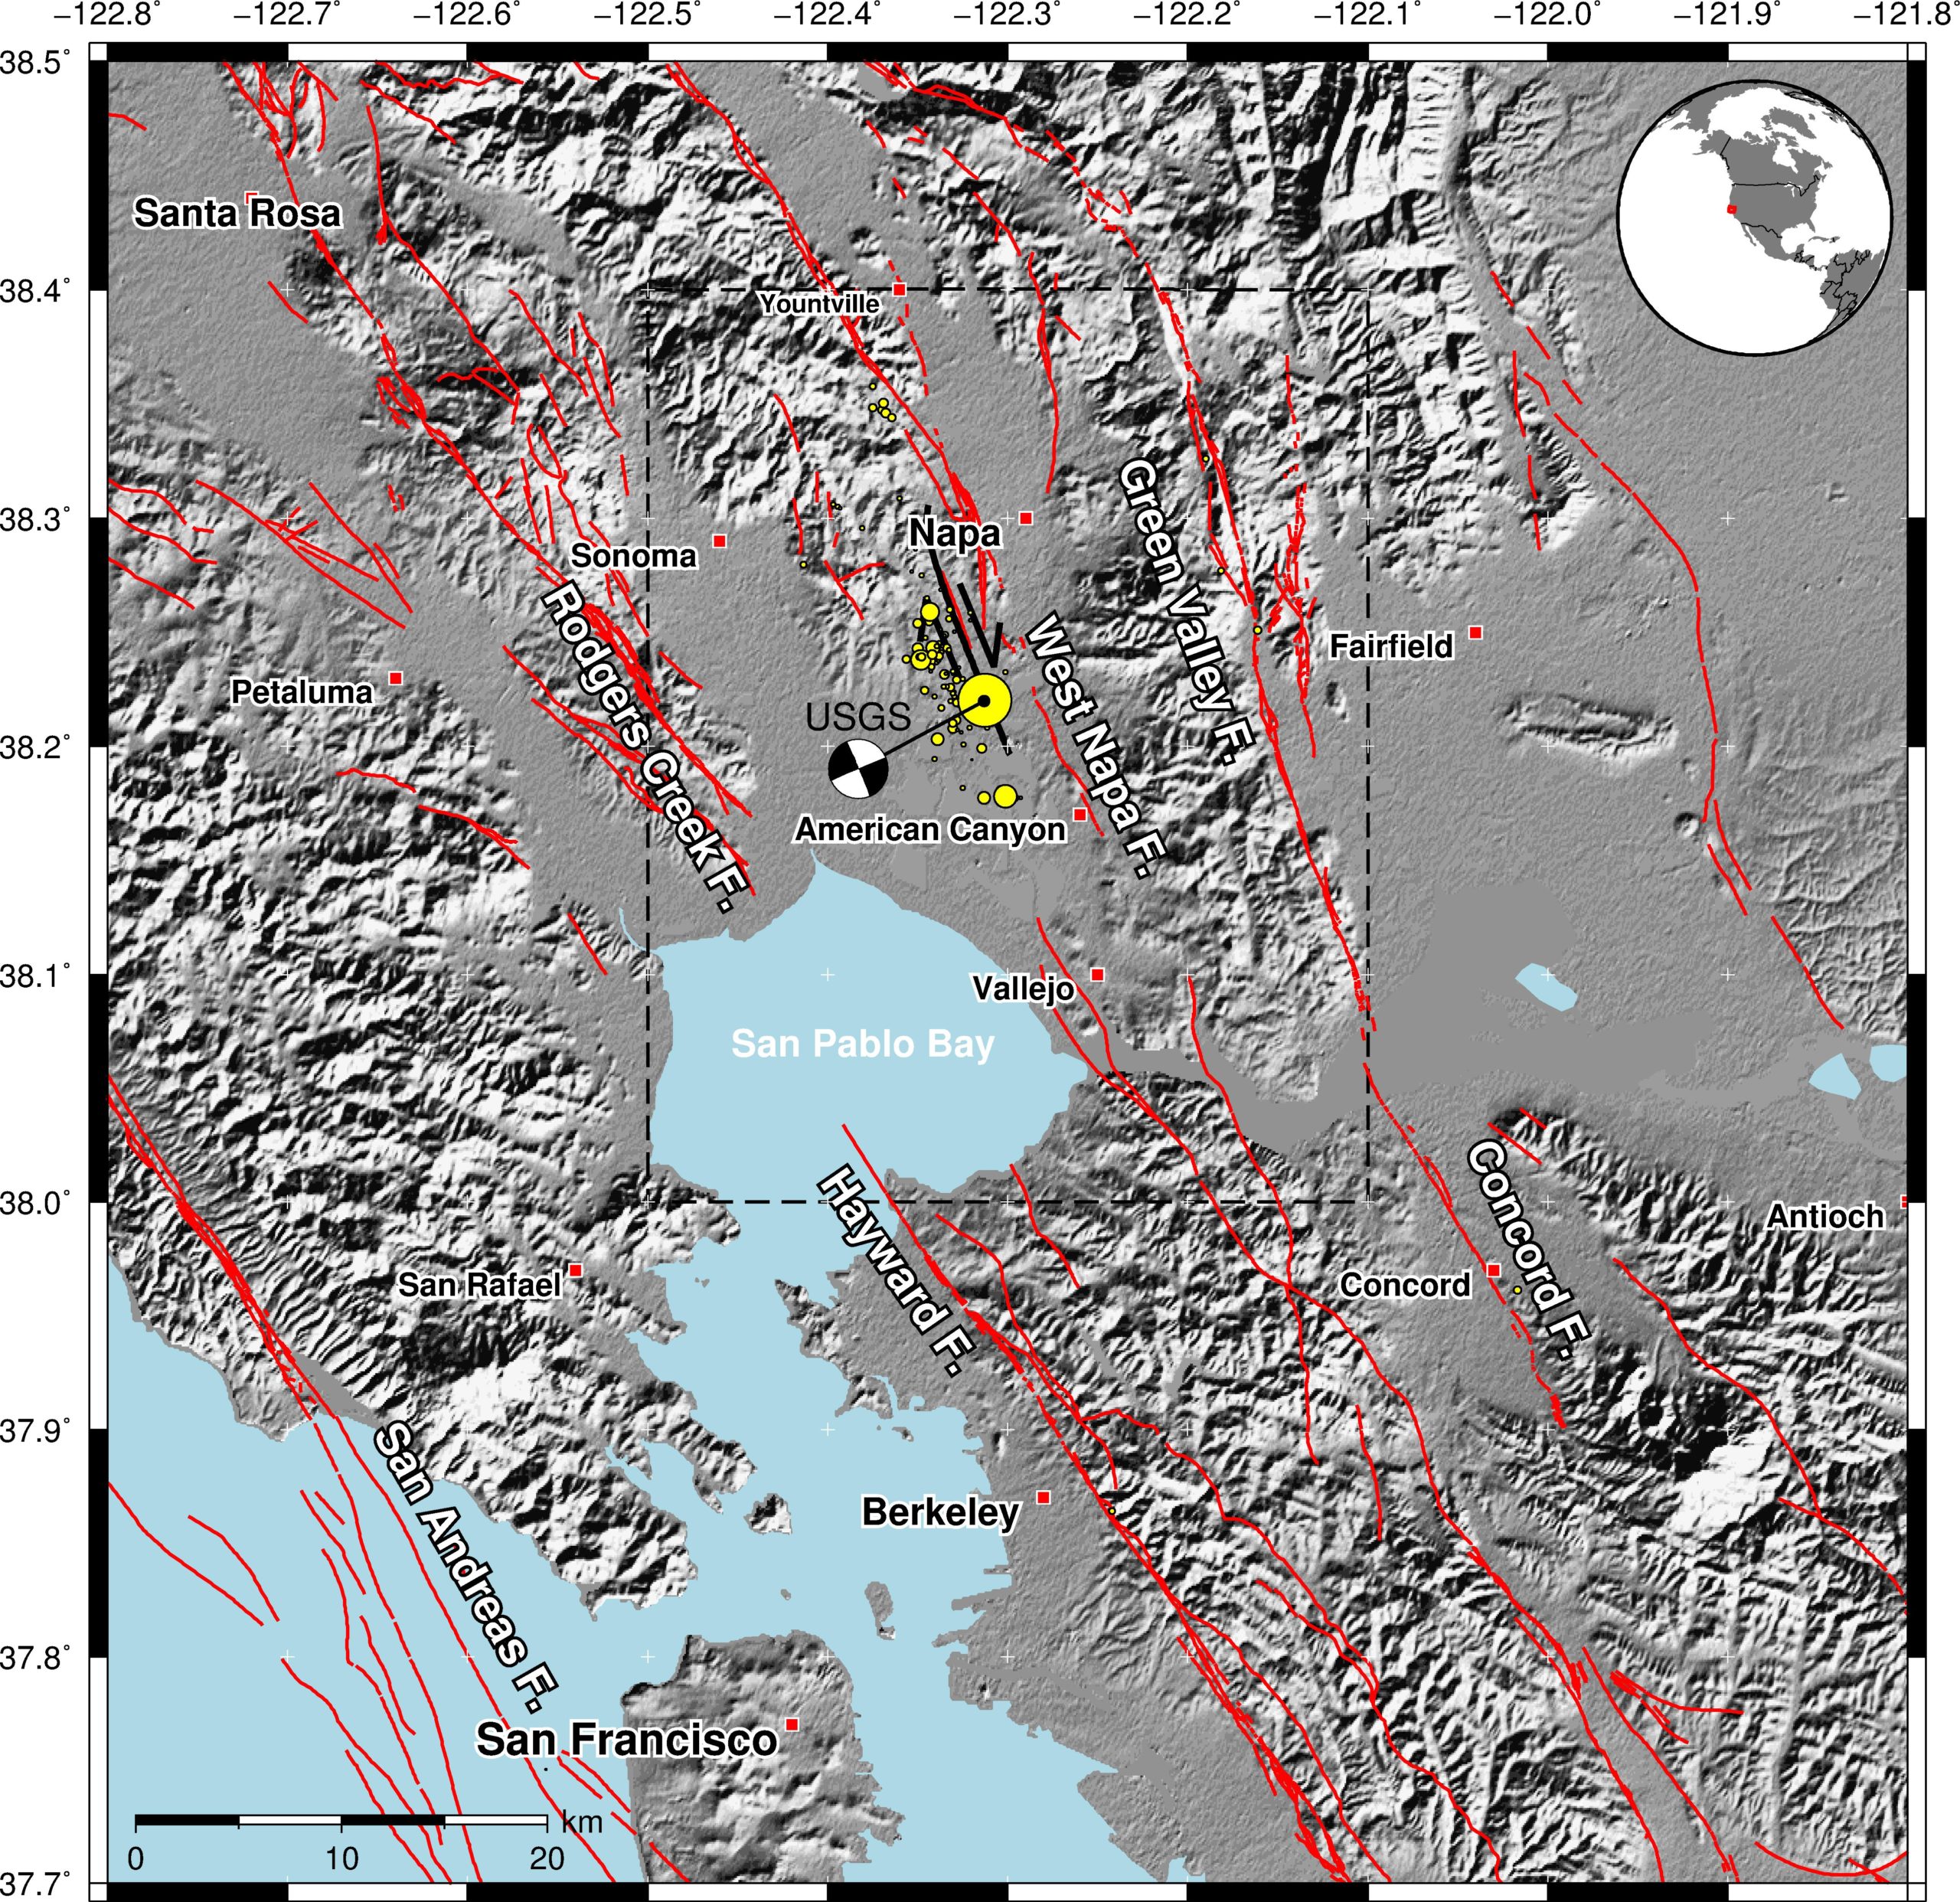
Fault map of the San Francisco Bay Area with faults in red colour. The fault rupture is shown by the black line, south-west of Napa (mapped by UC Davis scientists). The mainshock and smaller aftershocks are denoted by the yellow circles. Earthquake locations and existing fault locations sourced from USGS. Source: Earthquakes without frontiers.

Fault map of the San Francisco Bay Area with faults in red colour. The fault rupture is shown by the black line, south-west of Napa (mapped by UC Davis scientists). The mainshock and smaller aftershocks are denoted by the yellow circles. Earthquake locations and existing fault locations sourced from USGS. Source: Earthquakes without frontiers.

Sentinel-1A

Sentinel-1A was launched on 3 April 2014 as the first in a fleet of satellite missions of Europe’s Copernicus environmental monitoring programme. Sentinel-1A passes over the same spot on the ground every 12 days. However, once its identical twin, Sentinel-1B, is launched in 2016, this will be cut to just six days, so that changes deriving from natural hazards can be mapped even faster.

According to Austin Elliott, a PhD student at the University of California Davis involved in mapping the earthquake rupture on the ground “the data from satellites are invaluable for completely identifying the surface break of the earthquake – deformation maps from satellite imagery guide us to places where rupture has not yet been mapped.”

Source: ESA


Did you like this post about InSAR deformation maps? Read more and subscribe to our monthly newsletter!

Read on
Search