Recently we wrote about an interesting project that mapped light pollution around the world. The map has been generated based on satellite images of nighttime lights around the world. The problem with that approach is that it’s based on data from above not observations on the ground. In other words it’s a great way to get a global picture but it won’t provide you with enough data resolution to measure the light pollution in your neighbourhood.
Researchers from Nottingham Trent University developed a technology that might solve this problem. They’ve created a light weight, low-cost sensor system that allows to measure the light pollution. The device was designed to be mounted to a drone but it can be also used as a standalone tool. The new monitoring system is based on a microcontroller and standard servo motors, and the data it gathers is stored on an SD card. Ashley Fuller a researcher working on the project commented for Geoawesomeness:
The sensor that is being used to measure the light pollution is a Sky Quality Monitor or SQM for short. There are two different types of SQM there is the standard SQM and the SQM-L. The standard SQM has a cone of view for the light sensor of 84 degrees. The SQM-L has a cone of view of 20 degrees, this is good for taking reading at various angles from the zenith. The SQM-L comes with different port types such as the SQM-LE which has a Ethernet port and the SQM-LU which has a USB port. It is quite a simple device consisting of TSL237 light sensor and a microcontroller. The light sensor converts the frequency of light into a current then this signal gets processed by the micro controller and converted into a number that can be displayed in various ways. The sky brightness is given in the units of Mag arsec^-2.
Although it’s still to be tested in the field the team see it being used by for example national park rangers carrying out their work on site. Interestingly it’s yet another project that looks into drones as a platform for carrying sensors. Nice project!
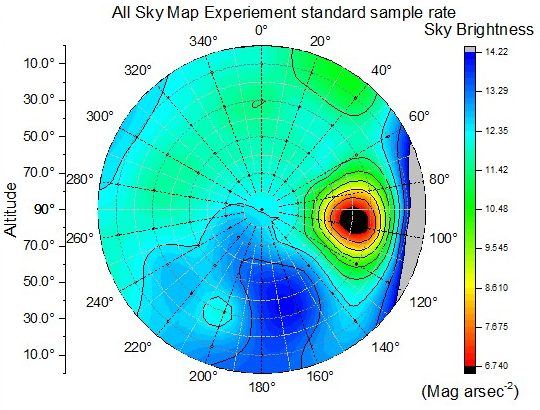
A sky map taken using the data collected from a calibration light source. The visualisation shows the distribution of light in one hemisphere and represents what is essentially a fish-eye view of the entire sky. Image credit: Ashley Fuller/Nottingham Trent University.


#Insights

Next article

Barcelona, the capital of Catalonia, is an amazing place to visit and to live. It’s a Mediterranean and cosmopolitan city with Roman remains, medieval quarters and the most beautiful examples of 20th century Modernism and avant-garde. When you walk around the city from the narrow streets of the old town to the wide modern ‘avenidas’ with Gaudi’s inspired buildings, you can see how Barcelona evolved over time. Now there is a cool tool to visualise it on the map.
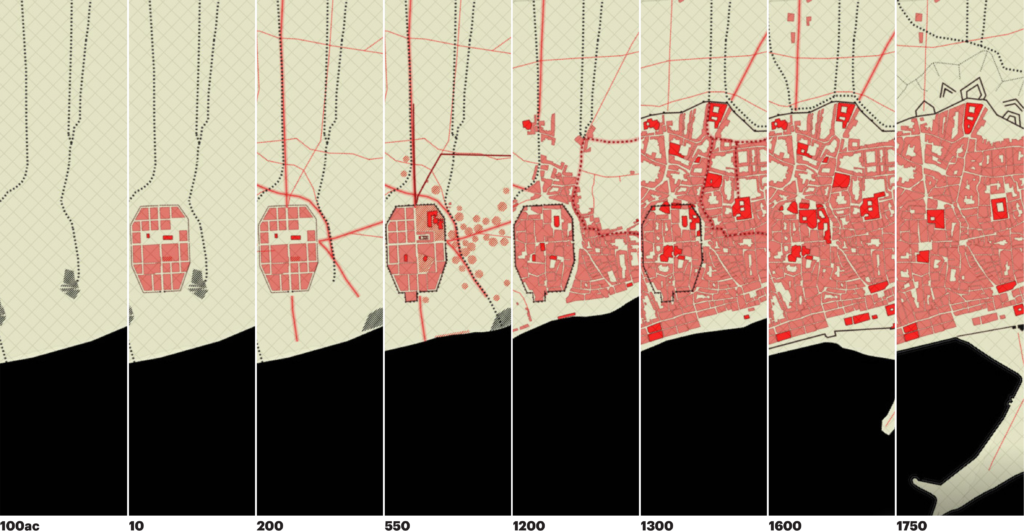
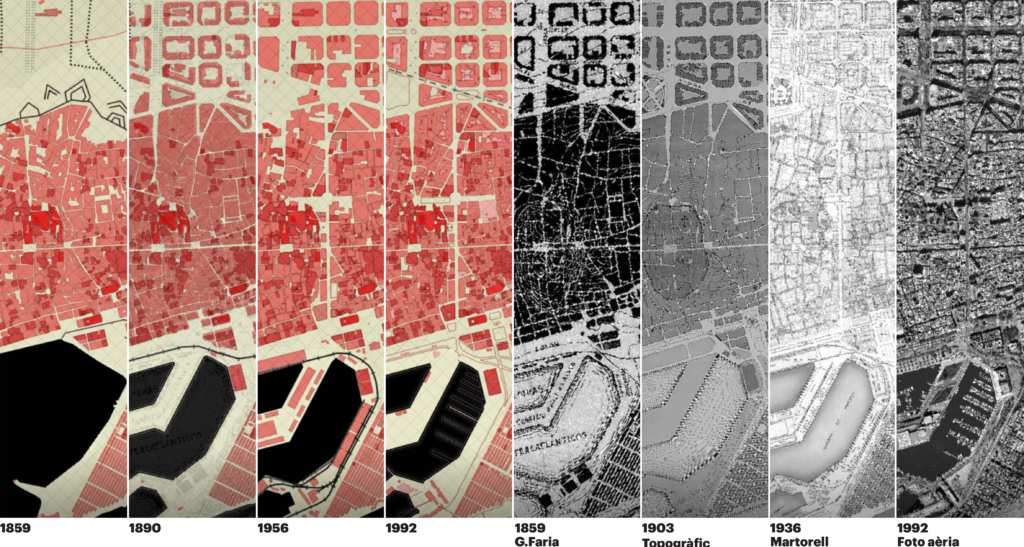
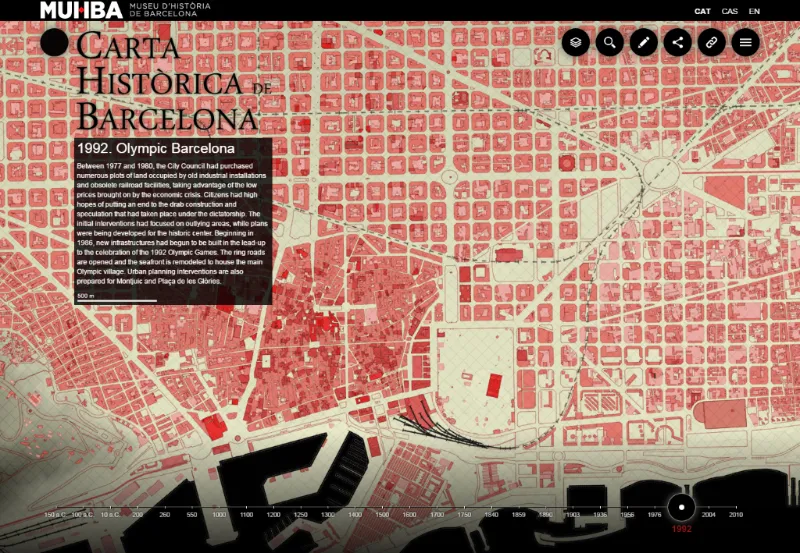
The Historic Charter of Barcelona is online interactive project that allows you to browse through the history of the city looking at maps from different eras. It contains 26 maps that have been drawn from texts, historical cartographies, archaeological maps, modern cartography and contemporary digital maps in cooperation with a committee of historians specialising in the various historical eras have cross-checked and corrected the documents under the direction of the Barcelona City History Museum.
Everything is served in cool and interactive way. In order to start you need to click on the timeline at the bottom of the website. Century by century you can observe how the city evolves and reaches its modern state. It’s definitely worth to spend couple of minutes playing around to get inspired.