#Featured #People

Learn all about Copernicus data services with this free new online course

The European Union’s earth observation program, Copernicus, is the third-largest space data provider globally. Catering primarily to six thematic areas (land, marine, atmosphere, climate change, emergency management, and security), Copernicus’ Sentinel satellites support several industries and applications, including regional and local planning, agriculture, forestry, fisheries, health, transport, climate change, sustainable development, tourism, environment protection, and disaster management.

With a full, free, and open data policy, the program currently supports hundreds of startups that have created new ventures using Copernicus data and information. The European Union is convinced Copernicus can generate up to $142 billion in societal benefits by 2035, which is why it regularly hosts hackathons and runs accelerator programs for geo-startups.
And now, the EU is funding a new online course for anyone who wants to understand how Earth Observation data can be used to address societal challenges and generate business opportunities.

The Copernicus MOOC (Massive Open Online Course) is an online training that begins on Monday, March 9, 2020. Consisting of 12 lessons of 2 hours each, over a period of 12 weeks, the MOOC is designed for anyone and everyone who uses or could benefit from using geoinformation data. The best part is that the course welcomes freshers, so it does not matter if you do not have any prior experience in using geospatial data.

The EU is encouraging all first-time and intermediate users of the Copernicus program from the public and private sectors to participate in the free online course. Civil servants, policymakers, entrepreneurs, innovators, intrapreneurs, service designers… everybody is welcome.

Copernicus MOOC focus areas

According to the registration website, the course will focus on three topics:

  • The lowdown on Copernicus data and services: What they are, and how they can be accessed and used
  • Success stories: How existing Copernicus-enabled services and applications have been developed and deployed
  • Doing it yourself: Acquiring the key skills and knowledge to develop and deploy Copernicus-enabled products and services and to navigate the Copernicus ecosystem.

The EU is promising a variety of engaging and interactive learning formats, including webinars, videos, use cases, and projects. A panel of renowned industry experts and successful practitioners has been put into place for the same.

To register for free, click here.

Say thanks for this article (1)
The community is supported by:
Become a sponsor
#Featured
#Environment #Featured #Humanitarian
Urban Damage Assessment Using SAR Data: The Case of Aleppo
Hassan Safieddine 02.14.2024
AWESOME 5
#Contributing Writers #Featured #Fun #Ideas #People
Share Your Insights: Geoawesome is Looking for Contributing Writers
Nikita Marwaha Kraetzig 01.18.2024
AWESOME 4
#Business #Featured #GeoDev
Geo Addressing Decoded, Part 4: Exploring the Applications of Geo Addressing Solutions
Aleks Buczkowski 06.25.2024
AWESOME 2
Next article
#Business #Featured

NASA images show Antarctic island losing 20% snow cover in 9 days

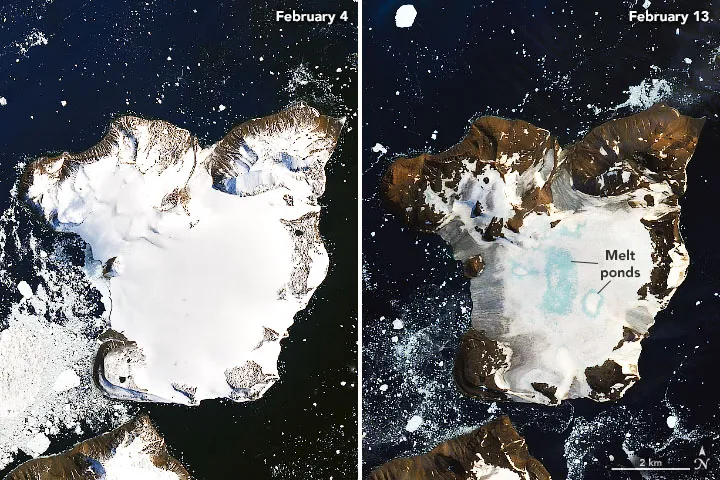
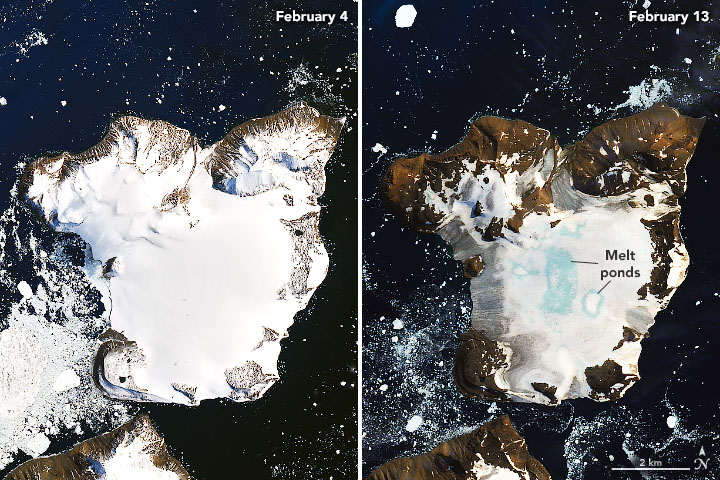
Antarctica may be the coldest place on Earth, but the continent has just witnessed the hottest temperature on record. On February 6, 2020, thermometers at a research station in Antarctica shot up to 18.4°C, beating the previous record of 17.5°C which was set on March 24, 2015. The warm winds, that arrived on Feb 5 and continued till Feb 13, resulted in widespread melting on nearby glaciers. So much so, an Antarctic island which was covered in snow until Feb 4 lost about 20% of its seasonal snow accumulation in just nine days.

NASA’s Earth Observatory has released the above images captured by Landsat 8 on Feb 4 and Feb 13. The side-by-side comparison clearly shows the melting on the ice cap of Eagle Island, a small island off Antarctica’s northwest tip. According to climate models, Eagle Island lost about 4 inches of snow in one week, leading to pools of meltwater opening up on its surface.

Glaciologist Mauri Pelto was shocked to see such rapid melting. “I haven’t seen melt ponds develop this quickly in Antarctica. You see these kinds of melt events in Alaska and Greenland, but not usually in Antarctica,” says Pelto, who has been a professor of environmental science at Massachusetts’ Nichols College and the director of the North Cascades Glacier Climate Project for more than 25 years.

Related: Is climate change responsible for heatwaves and wildfires?

According to NASA, the heat wave was caused by a combination of meteorological elements. High pressure centered over Chile’s Cape Horn at the beginning of February allowed warm temperatures to build. Typically, a band of strong winds that circle the continent – the Southern Hemisphere westerlies – would have shielded the continent. But with the westerlies in a weakened state, the extra-tropical warm air could reach the ice sheet.

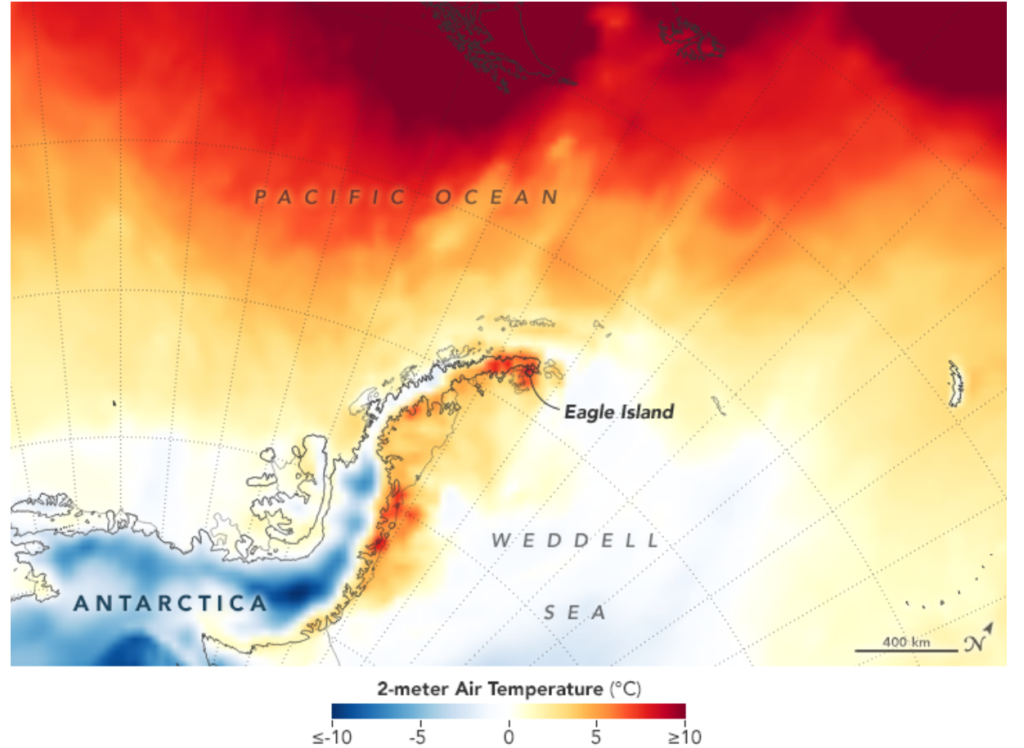
In the map above, you can see temperatures across the Antarctic Peninsula on February 9, 2020. The map was created using the Goddard Earth Observing System (GEOS) model, and showcases air temperatures at 2 meters above the ground. The darkest red areas are where the temperatures have crossed 10°C.

As NASA points out, the February heatwave was the third major melt event of the 2019-2020 summer, following warm spells in November 2019 and January 2020. “If you think about this one event in February, it isn’t that significant,” Pelto explains. “It’s more significant that these events are coming more frequently.”

Read on
Search