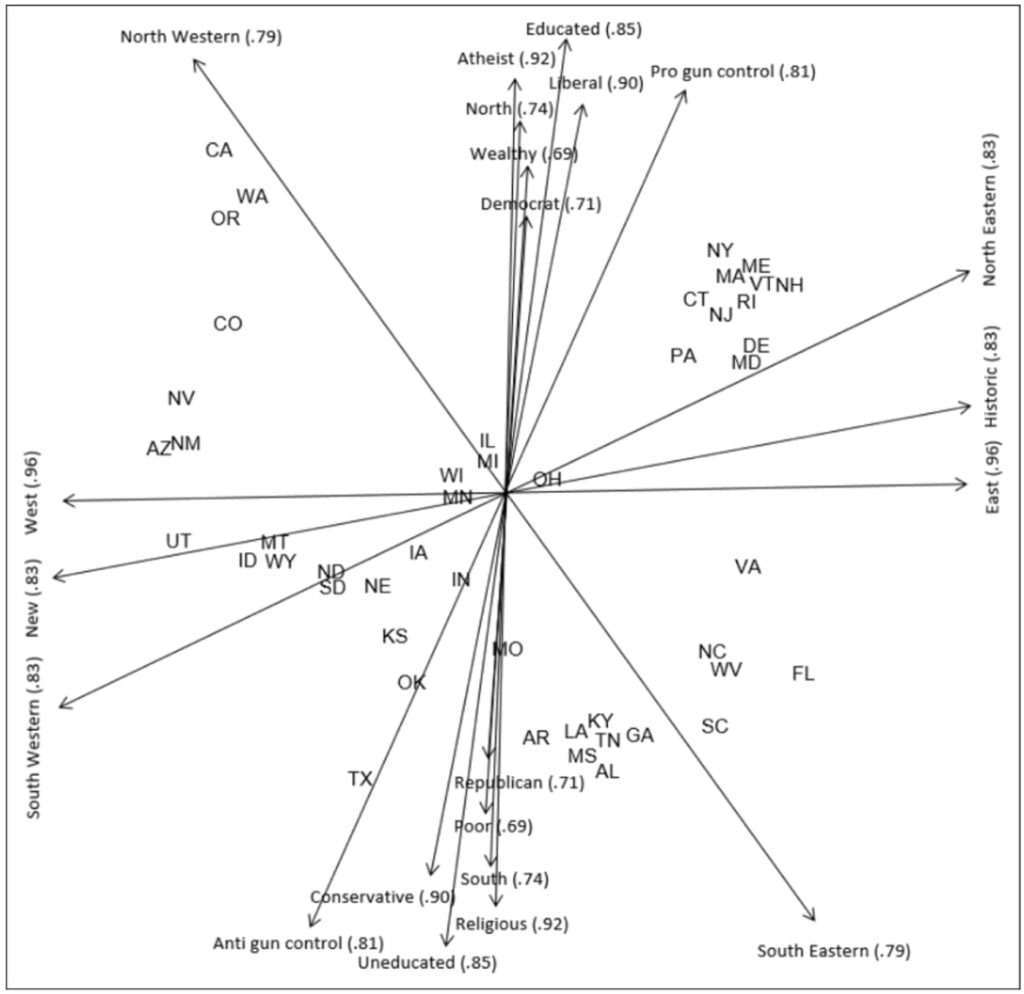
Cognitive map of the United States
In new research, academicss were able to model and study the cognitive map of the US states. Cognitive maps inform how people, on average, make sense of the world they live in. On this cognitive map, California is closer to Washington state than to Nevada, where West Virginia is closer to South Carolina than to Maryland, and where Ohio is close to the center of the country.
This US cognitive map was drawn by A. Koch (University of Cologne), N. Kervyn (Louvain School of Management) M. Kervyn (Free University of Brussels) and R. Imhoff (Mainz University) by collecting results from over 1300 US citizens from the 48 mainland US states. Their novel approach published in Social Psychological and Personality Science (http://www.spsp.org/news-center/press-releases/cognitive-map-usa-ideology-prosperity) combines cognitive science, geography and marketing.
The authors computed this map by providing a deck of cards to US citizen from across the US recruited online. Each card represented one of the 48 mainland states. Participants were asked to organize these cards on their screen by grouping together the states that they though were similar. The authors then analyzed these results using multidimensional scaling which reliably led to the US cognitive map displayed above. Further polling of US citizens allowed the researchers to interpret this map. Results showed that the states are organized along a geographical axis (east-west) and an ideological axis (atheist-religious; conservative-liberal). The cognitive map is thus more influenced by the perception of states as religious or not than by the north-south dimension. In fact, the ideological dimensions religious-atheist and conservative-liberal, and the prosperity dimension uneducated-educated all explained the states’ position on the cognitive map better than north south (higher numbers in the parentheses in the map indicate higher explanatory value). Additional analysis using census data led to the same conclusions.
Further data collection showed that the appreciation that US citizens have for the different states is determined by distances on the cognitive map. States that are nearby on the cognitive map are liked more than states that are far away. These cognitive distances have more influence on liking of other states than geographical distance.
The cognitive map shows that the US states are organized in a number of clusters separated by wide gaps. The maps thus help visualize the great divide between rather liberal and rather conservative states debated during the past few presidential elections. There is also a possible historical interpretation of this map as, on the east coast, there is a clear division between the former union and confederate states.
Another consequence is for the tourism industry. For a given state’s tourism office the map can inform them about the states that are close to it in cognitive distance and thus likely to have a positive view of their state. On the other hand; it means that they could position their state as an exotic destination for traveler from states that are far away on the cognitive map.


