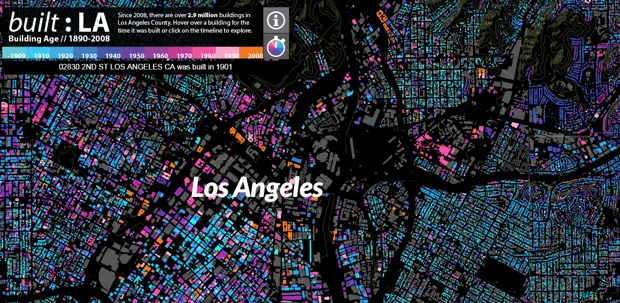
build:LA – map of LA’s urban development
Some time ago we wrote about a cool map which showed a history of Brooklyn’s urban development by visualizing age of every building in the district. It showed that the structure of the biggest by population New York borough is still very similar to how it looked a century ago. Most of buildings built at that time are still there. The case with LA seems to be a little bit different. Media are rumbling about “classic” L.A. homes being displaced by even bigger new houses, changing the face of old neighbourhoods.
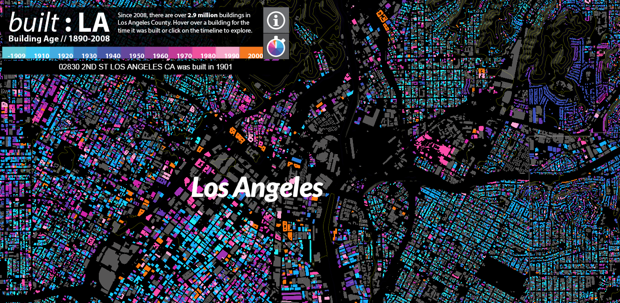
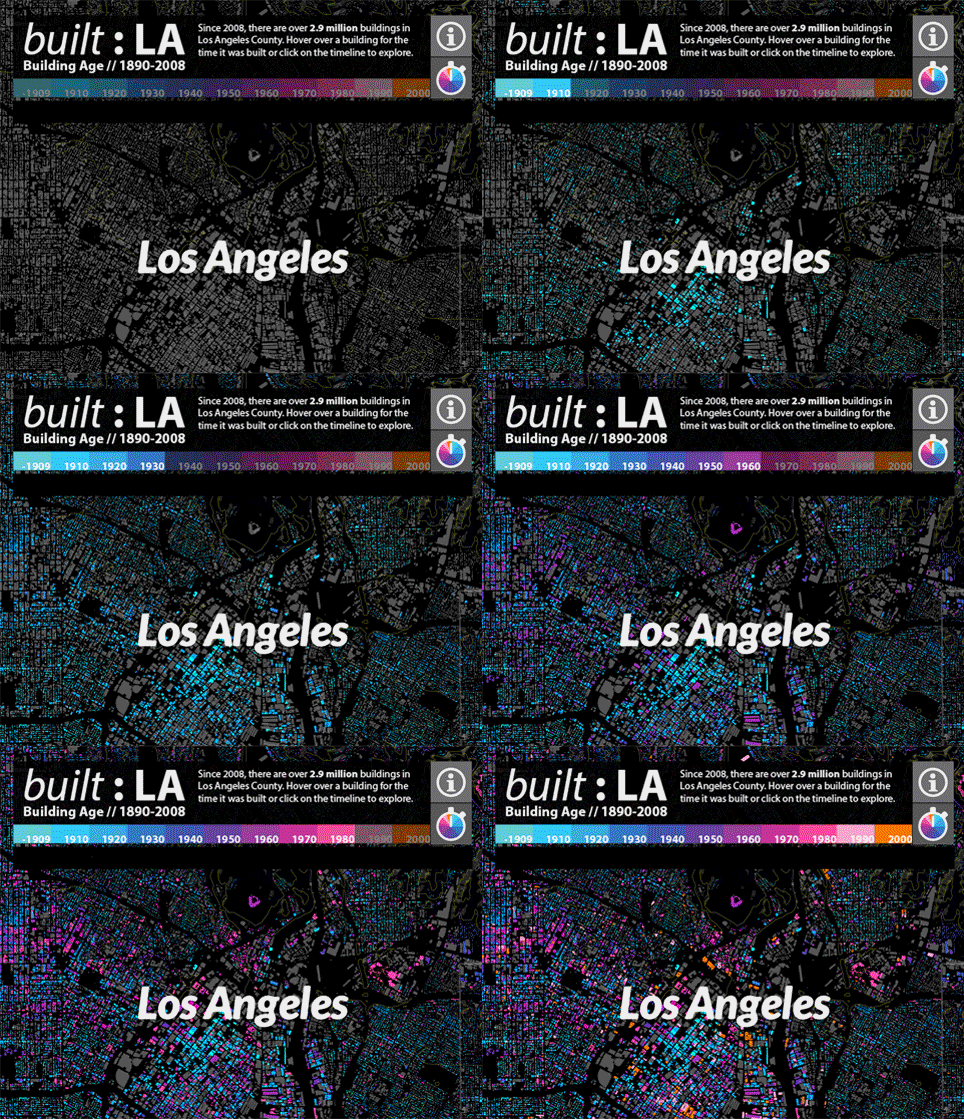
Urban designer Omar Ureta created an interactive map which will help to tell you the full story. It shows general patterns but also particular stories behind these urban changes. The project called built: LA visualizes the age of 2.9 million buildings across L.A. County constructed between 1890 and 2008. Ureta combined a data about shapes of buildings from Los Angeles County’s GIS data portal with their age information from UCLA’s Mapshare website. The effect is a stunning decade-by-decade timelapse of development across the city. Play around. It’s quite cool.


