
On February 6th 2023, a devastating 7.8 magnitude earthquake, followed by a 7.5 magnitude aftershock, struck southeast Turkiye and northwest Syria. This catastrophic event resulted in over 52,000 confirmed deaths, with millions of people affected. MapAction began their response in the early hours of February 6th, working remotely to update key maps and data. Coordinating with UN agencies and other emergency response partners, MapAction supported search and rescue operations, mapping collapsed sites, hospital locations, and transport hubs.
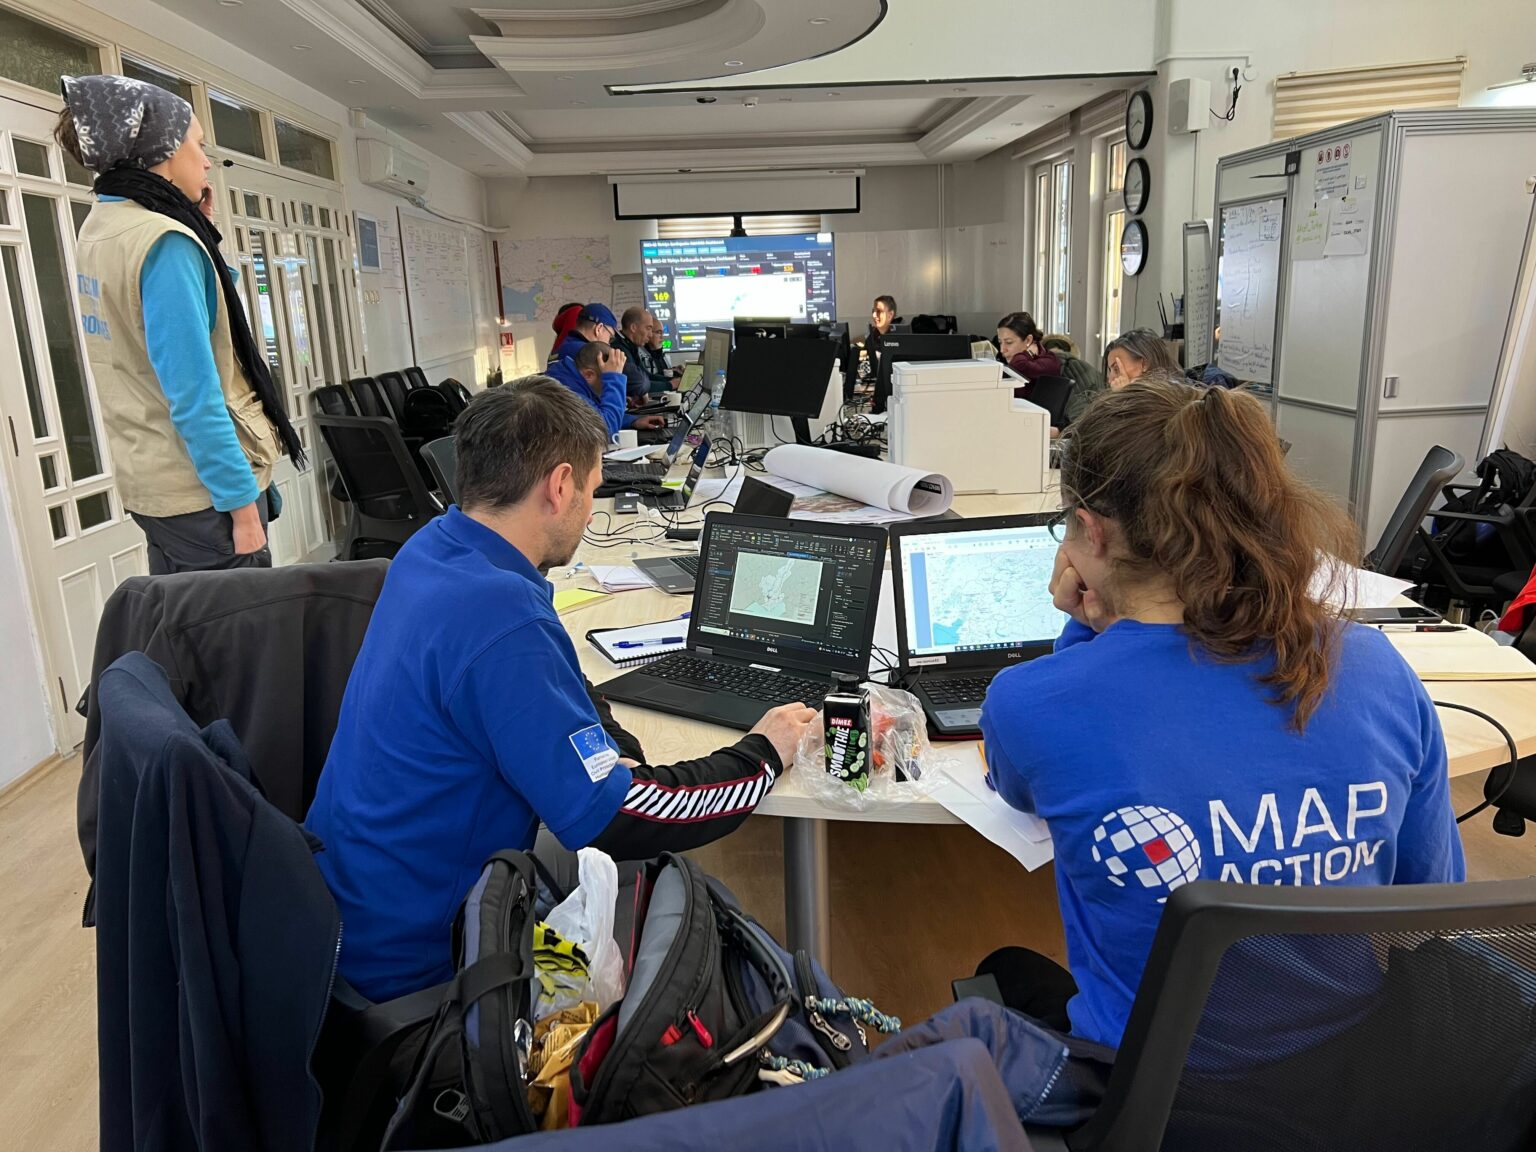
MapAction Field Team members working in the UN Onsite Operations Coordination Centre in Gaziantep, Turkiye, Source: MapAction
In 2022, Malawi faced a severe cholera outbreak, with cases escalating dramatically by December. The Missing Maps team from Doctors Without Borders (MSF) initiated remote mapping support to aid the emergency response. They launched several mapping projects using tools like Mapswipe and HOT Tasking Manager to map buildings and residential areas.
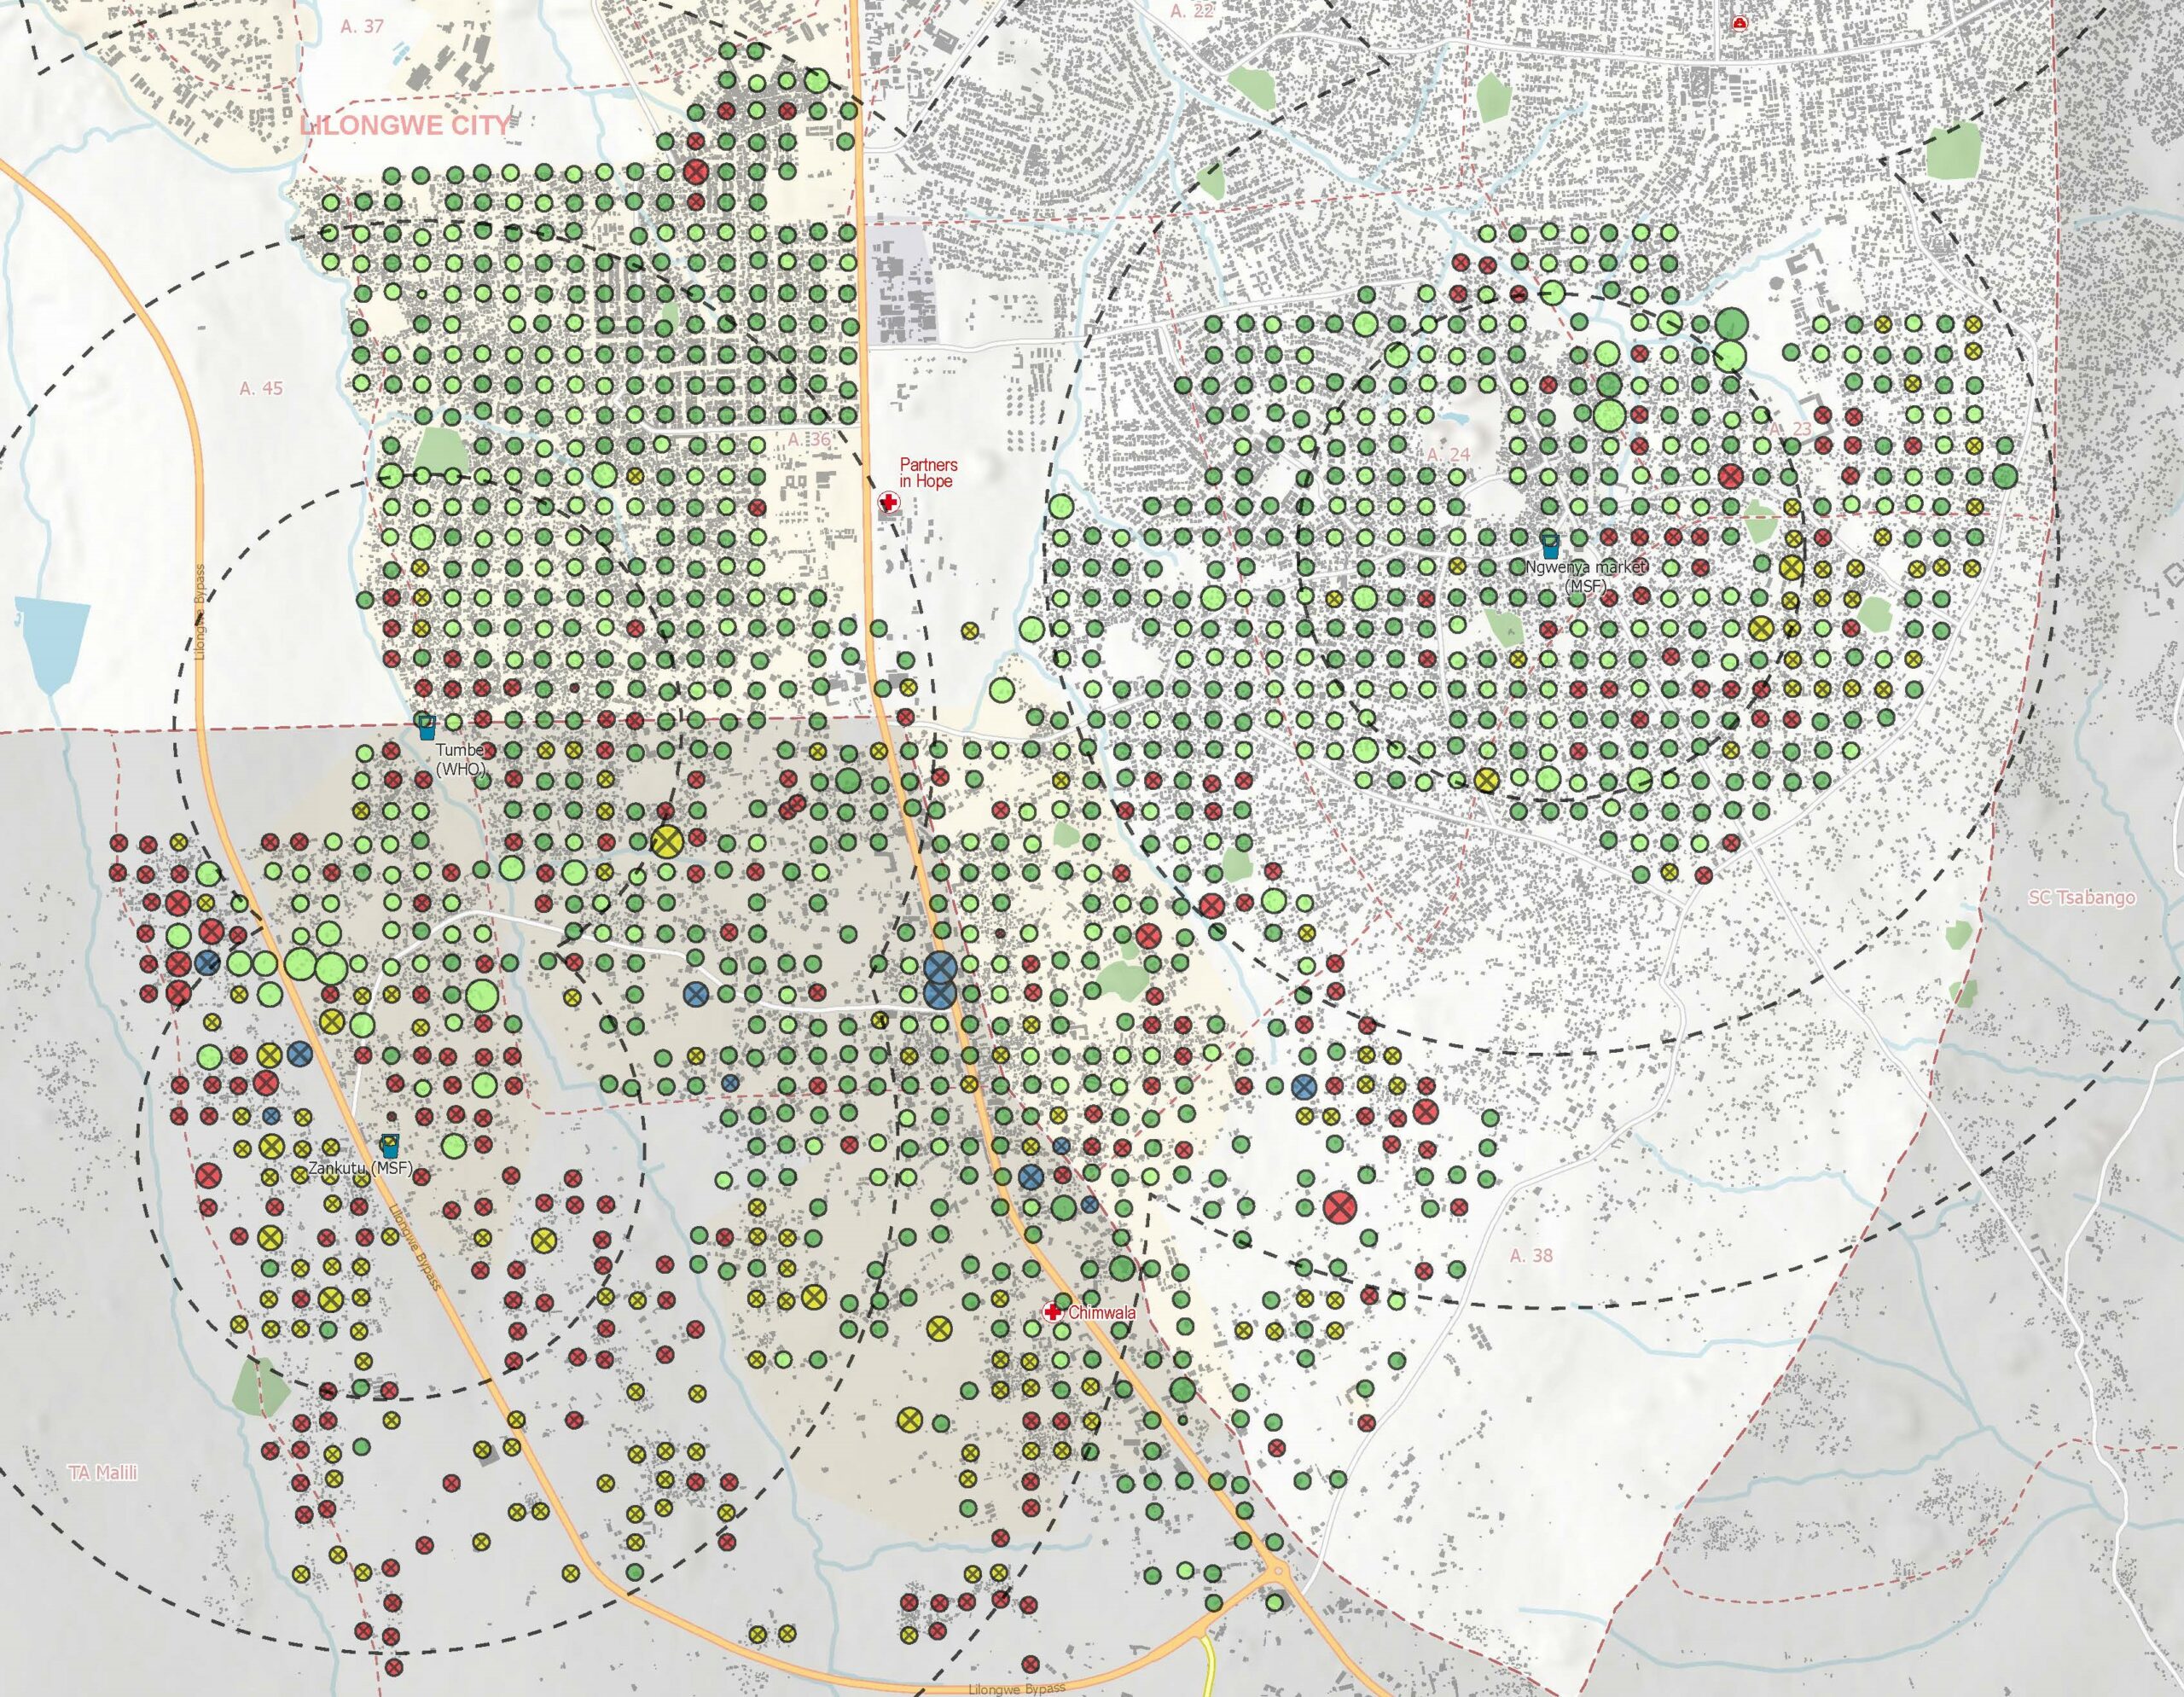
Map used for a field survey on water access safety in Lilongwe. Malawi 2023, Source: MSF
These two tragic events in the last two years show us the field of geohumanitarian service. The term geohumanitarian refers to the application of geospatial technologies and data for humanitarian purposes, ranging from disaster response and aid delivery to crisis mapping and communication.
Geohumanitarian mapping organizations play a vital role in disaster response and humanitarian aid efforts. Geohumantiarian efforts have increasingly gained significant attention, especially in the wake of natural disasters and humanitarian crises. They provide up-to-date geographic data and mapping services.
Mapping services consist of two key contributors: Volunteered Geographic Information (VGI) ND Professional Geographic Information (PGI). While VGI and PGI encompass a broad range of definitions, this article will focus on the participants who contribute towards geohumanitarian services.
Organizations such as MapAction provide professional mapping services. Unlike VGI, which relies on the contributions of ordinary citizens, PGI requires professional knowledge and expertise in GIS. These organizations employ skilled professionals who are trained to create highly accurate and detailed maps critical for disaster response and humanitarian aid.
VGI represents the other vital component of geohumanitarian mapping services. VGI leverages the power of community contributions, where ordinary citizens participate in creating and updating geographic data.
Lots of ‘Maps’ and Mappers, who are they?
When people first read news about geohumanitarian services, they often find themselves confused by the multitude of mappers and mapping groups involved. Who are these organizations, and what exactly are they doing?
This section aims to clarify the roles and contributions of various mapping organizations, especially for those new to this field. Let’s briefly introduce them one by one.
Organizations based on VGI: The Power of Crowdsourcing
OpenStreetMaps (OSM): The biggest crowdfunding mapping project
Before delving into the other mapping organizations, it’s essential to know OSM, an organization that existed even before the VGI concept was widely recognized. Most GIS students know OSM. Founded by Steve Coast in 2004, OSM is a collaborative project that creates and distributes free geographic data for the world. As of now, it boasts more than 10.2 million users.
A notable example of OSM’s impact was during the 2010 earthquake in Haiti. The OSM community quickly initiated a mapping project using current satellite images to provide crucial geospatial data to rescue workers and the affected population. Within days, the community had produced a detailed city map of Port-au-Prince, including bridges, infrastructure, and damaged buildings, which was updated hourly.
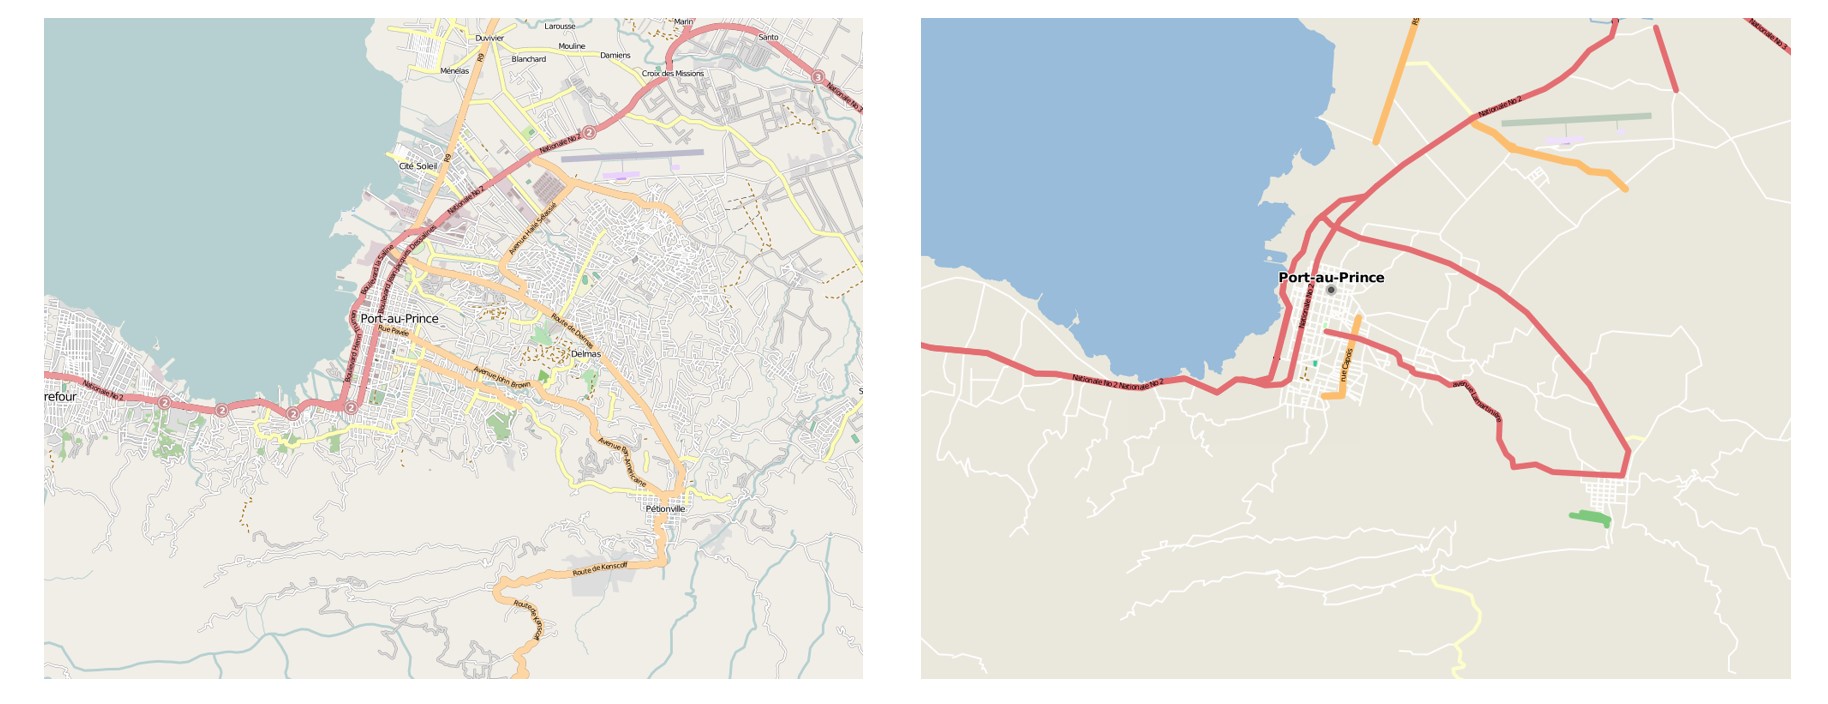
OpenStreetMap Port au Prince Before and After the 2010 Haiti Earthquake, Source: Mikel Maron
Humanitarian OpenStreetMap Team (HOT): The first community-driven disaster mapping
The idea of using OSM for disaster response was first presented in 2005 at the European Commission. After several years of development and testing, the first activation of the Humanitarian OSM Team (HOT) for humanitarian purposes occurred during the Gaza crisis in January 2009. They did this by creating a free and open map of Gaza by mobilizing volunteer mappers to digitize buildings, roads, and infrastructure from satellite imagery. This assisted humanitarian organizations with logistics and relief operations once they were allowed to deploy in Gaza. HOT’s mapping work in 2009 aimed to fill crucial data gaps from existing map sources such as the UN and the BBC.
Founded in 2010, HOT was Incorporated as a U.S. nonprofit organization committed to humanitarian action and community development through open mapping. Another significant project for HOT was the January 2010 Haiti earthquake. Hours after the quake, HOT traced roads and buildings in Port-au-Prince from existing satellite imagery to create a basemap for responding organizations. This soon became the default basemap used by search and rescue teams.
Since its formation, HOT has grown significantly, mapping in over 60 countries and engaging in more than 100 projects. As of now, HOT has mobilized 468,000 mappers, facilitated 246.7 million map edits, and mapped 147.5 million buildings. Their core objective is to mobilize or support one million contributors to map an area home to one billion people by 2026.
In 2023 during the Turkey & Syria Earthquake, HOT collaborated with the Turkish open mapping community Yer Çizenler, mobilizing nearly 7,000 contributors to map almost 1.5 million buildings and over 66,000 kilometers of road within two weeks.
Some of you might have encountered mapping organizations known as Open Mapping Hubs, each followed by a regional name. Don’t worry, these are regional hubs operated by the HOT. Together, HOT and partners such as Open Mapping Hub Asia Pacific created multiple Tasking Manager projects covering the affected areas in Turkey and northern Syria to coordinate collaborative online mapping.
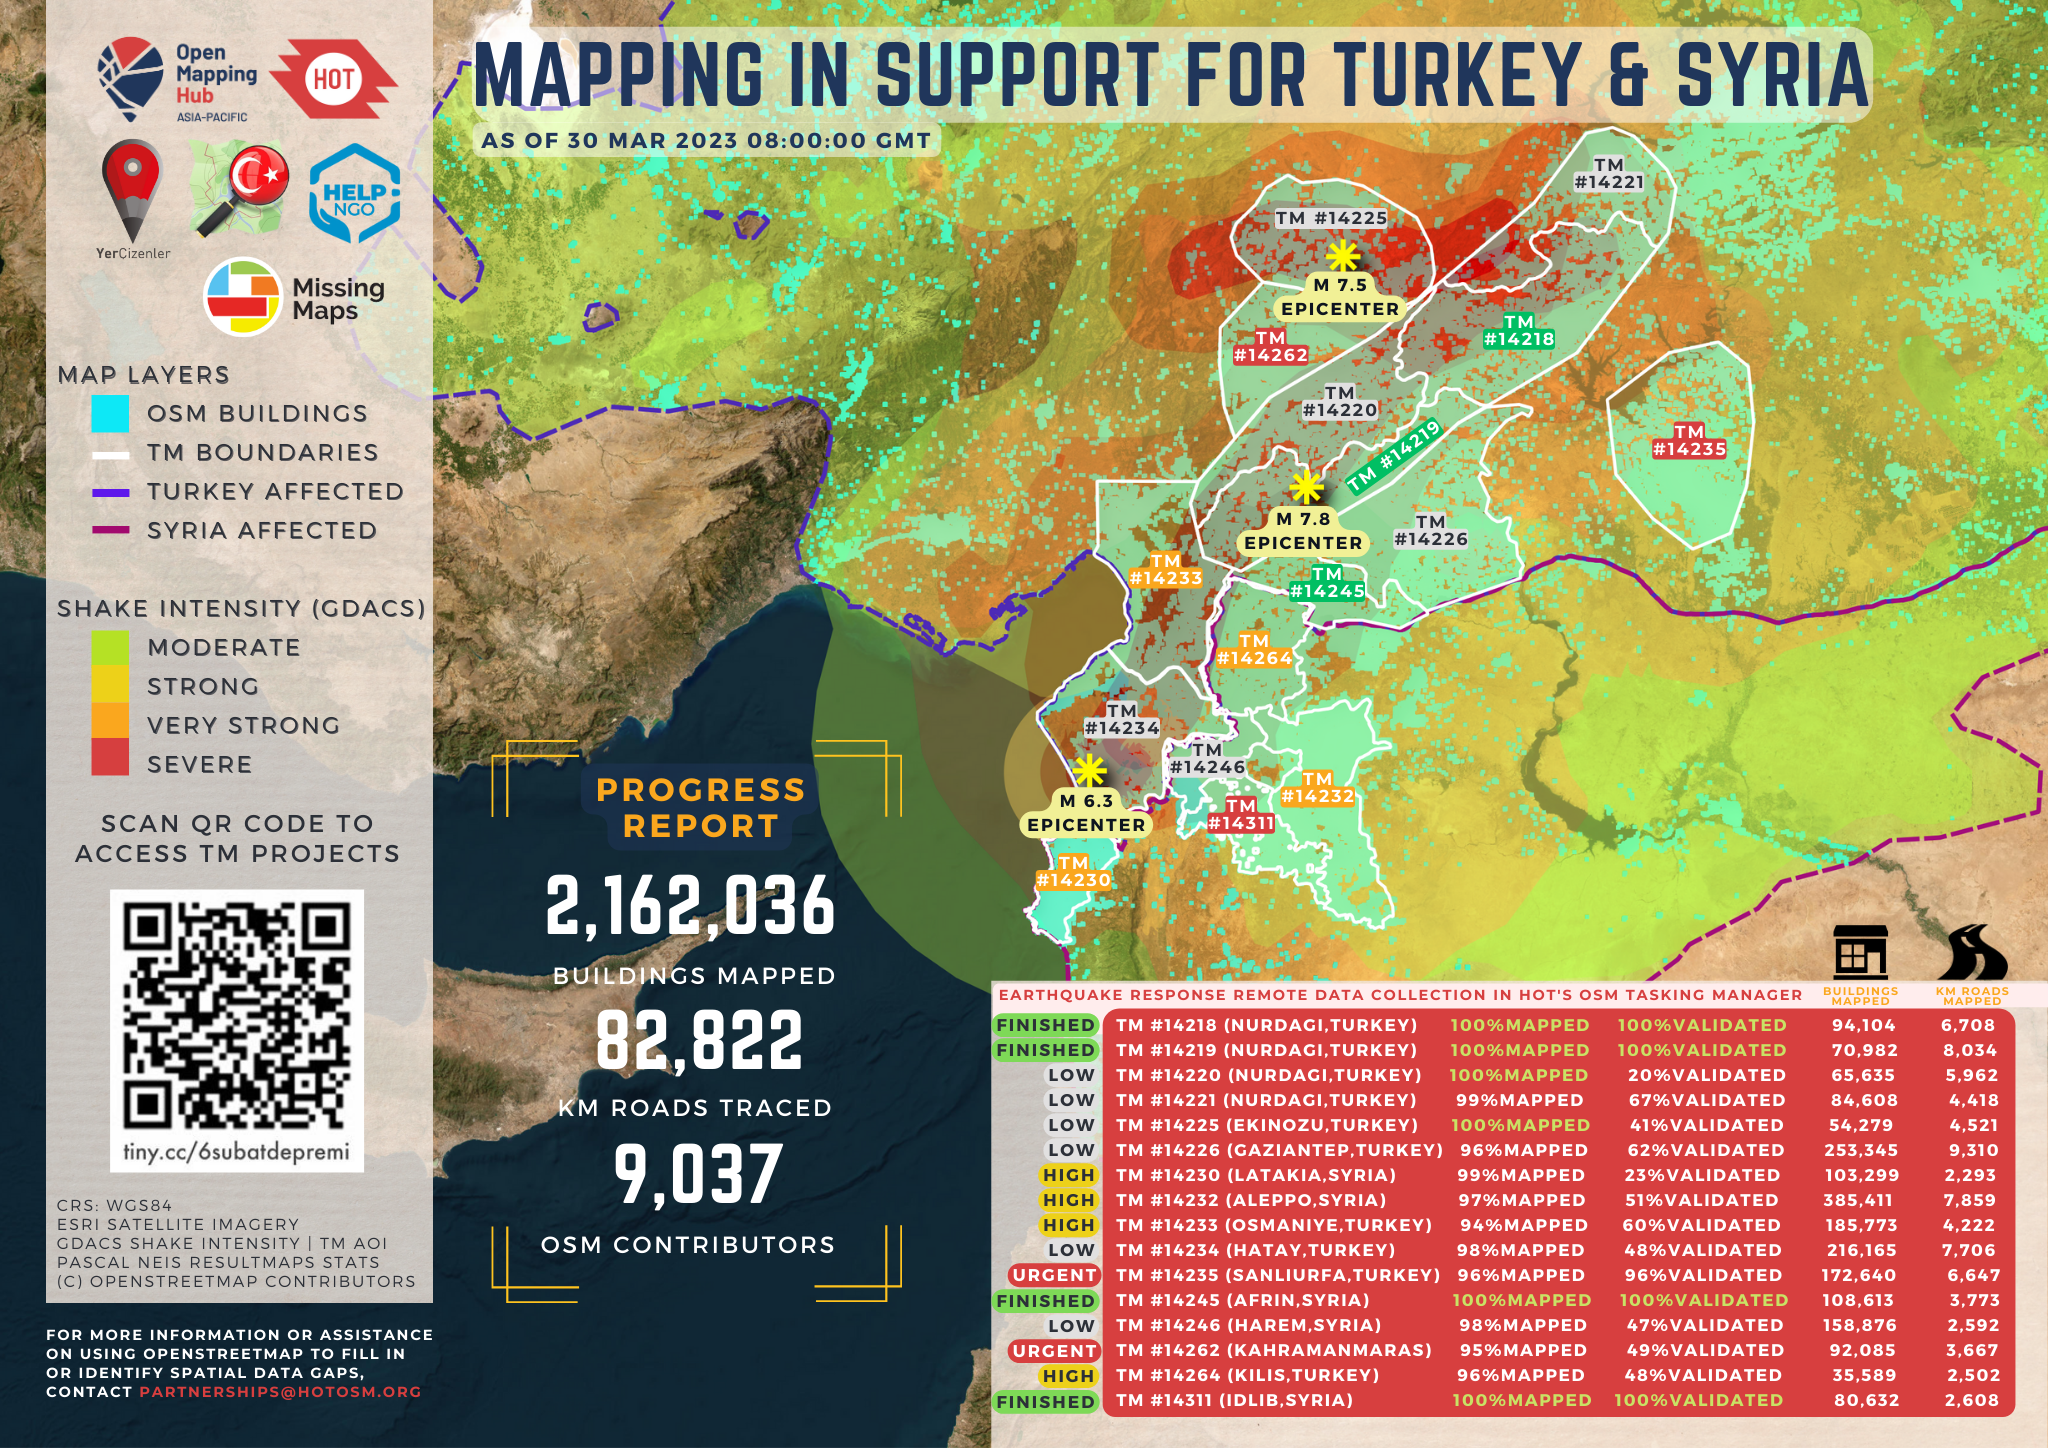
Mapping in support for Turkey and Syria, Source: HOT
Mapping in support for Turkey and Syria, Source: HOT
YouthMappers: We don’t just build maps, We build mappers
Created in 2014 and officially launched in 2015, YouthMappers is an international consortium of university student mapping clubs made up of students, researchers, educators, and scholars.
Founded by Texas Tech University, George Washington University, and West Virginia University, with Arizona State University as the lead administrative partner, YouthMappers is focused on mapping for humanitarian and development purposes.
The consortium has an international network of student-led chapters, such as YouthMappers at TU Munich. Currently, it has nearly 400 chapters across Africa, Europe, Asia, and the Americas.
YouthMappers’ mission is to cultivate a generation of young leaders to create resilient communities by mapping and using open geospatial data.
They offer a variety of programs to foster leadership, research, and inclusivity among its members. The “Let Girls Map” campaign, launched in 2016, encourages female mappers to engage in mapping activities.
The YouthMappers Research Fellowship is a 9-month program that uses open geospatial data to study the resilience of vulnerable populations. This provides training in open mapping techniques and youth leadership to enrich chapter activities and promote youth leadership on university campuses.
Additionally, YouthMappers Regional Ambassadors support chapters with technical training and help expand the network by recruiting motivated students.

Source: YouthMappers
Missing Maps: Collaborative projects for humanitarian aid
Missing Maps is a unique collaborative project, aimed at creating accessible map data for areas where humanitarian organizations operate.
Founded in November 2014, Missing Maps was initiated by a coalition of the HOT, Médecins Sans Frontières (MSF), the British Red Cross, and the American Red Cross. The project has since grown to include over 15 member organizations, ranging from NGOs to educational institutions and civil society groups.
So, if you see the logos of MSF and Red Cross organizations in various mapping projects, don’t be confused. These organizations have been supporting mapping initiatives for over a decade, contributing to the creation of detailed and accessible maps for humanitarian aid. At the same time, the open map data enables humanitarian groups like MSF and the Red Cross to navigate crisis areas, plan logistics, track disease spread, and deliver aid more effectively. The maps are used for disaster response, epidemic control (e.g. Ebola, cholera), risk reduction, and spatial planning by NGOs and health agencies.
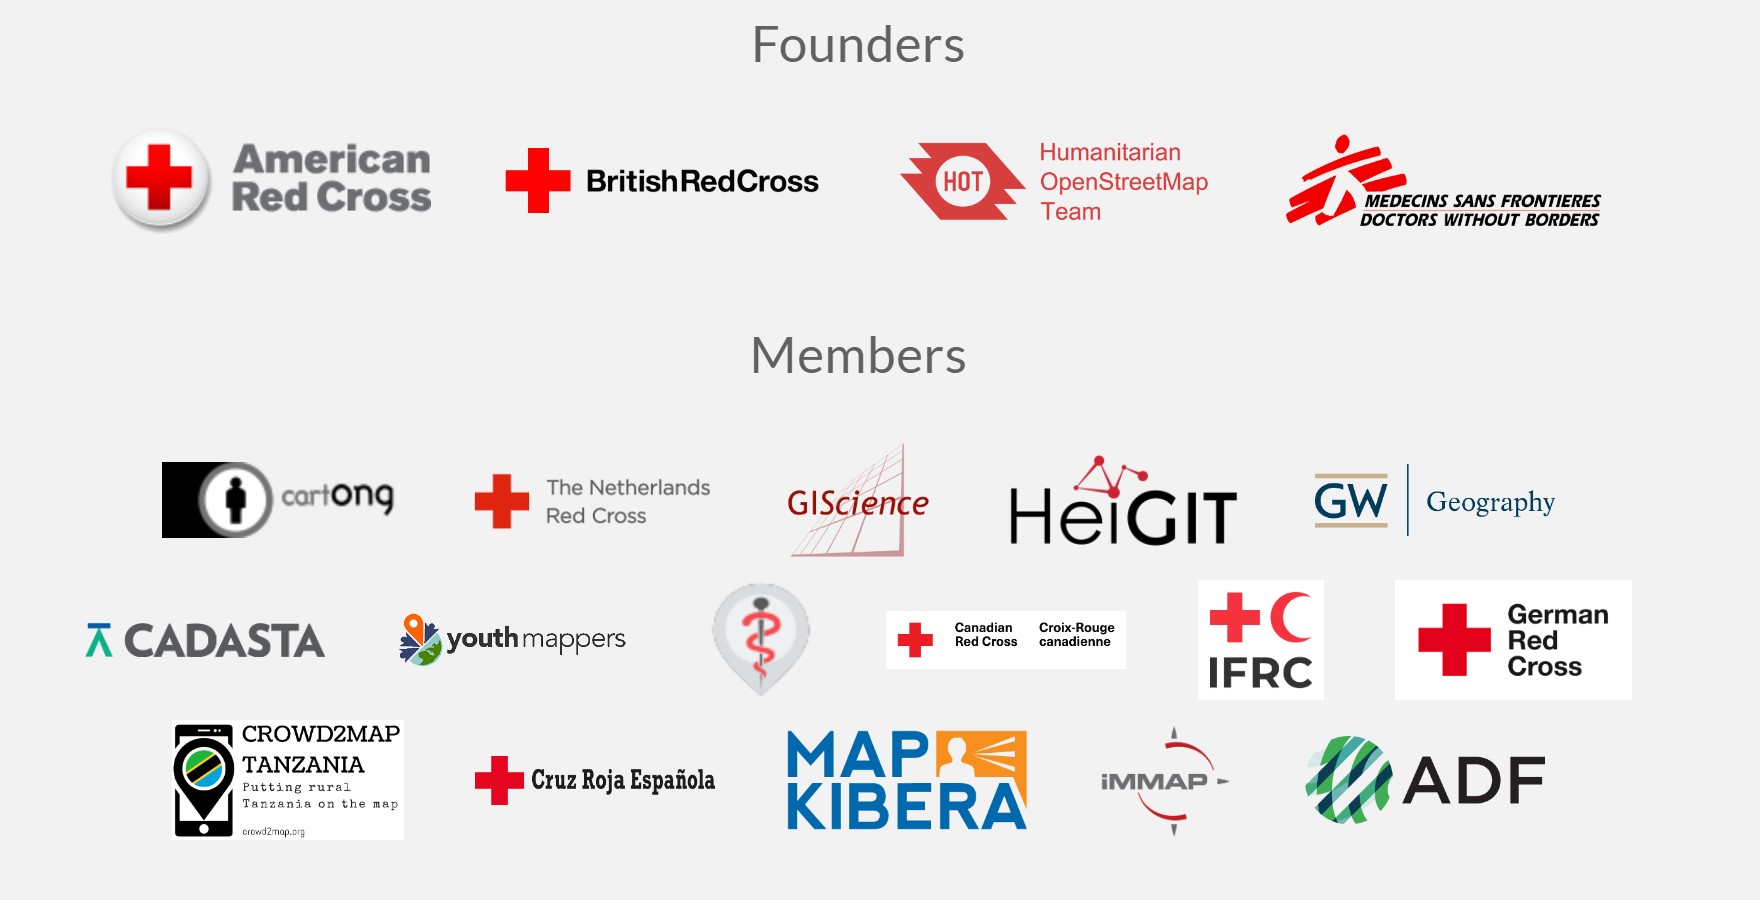
Members in Missing Maps, Source: Missing Maps
The primary goal of Missing Maps is to preemptively map vulnerable parts of the world, ensuring that detailed maps are available for first responders in the event of disasters, conflicts, or disease epidemics. Volunteers digitally trace satellite imagery to map roads, buildings, infrastructure, etc, in outdated or unmapped areas using the HOT Tasking Manager. Field teams then validate these areas and update the maps with local names and details by working with communities on the ground.
The project has successfully mapped large towns, cities, and rural areas in countries such as South Sudan, the Democratic Republic of the Congo, and the Central African Republic. By utilizing the OpenStreetMap (OSM) platform, Missing Maps ensures that all collected data is freely available for anyone to use.
Since its inception, nearly 100,000 volunteers have contributed to Missing Maps, mapping over 45 million buildings and more than 1 million kilometers of roads, significantly enhancing the capacity for humanitarian response and community resilience.
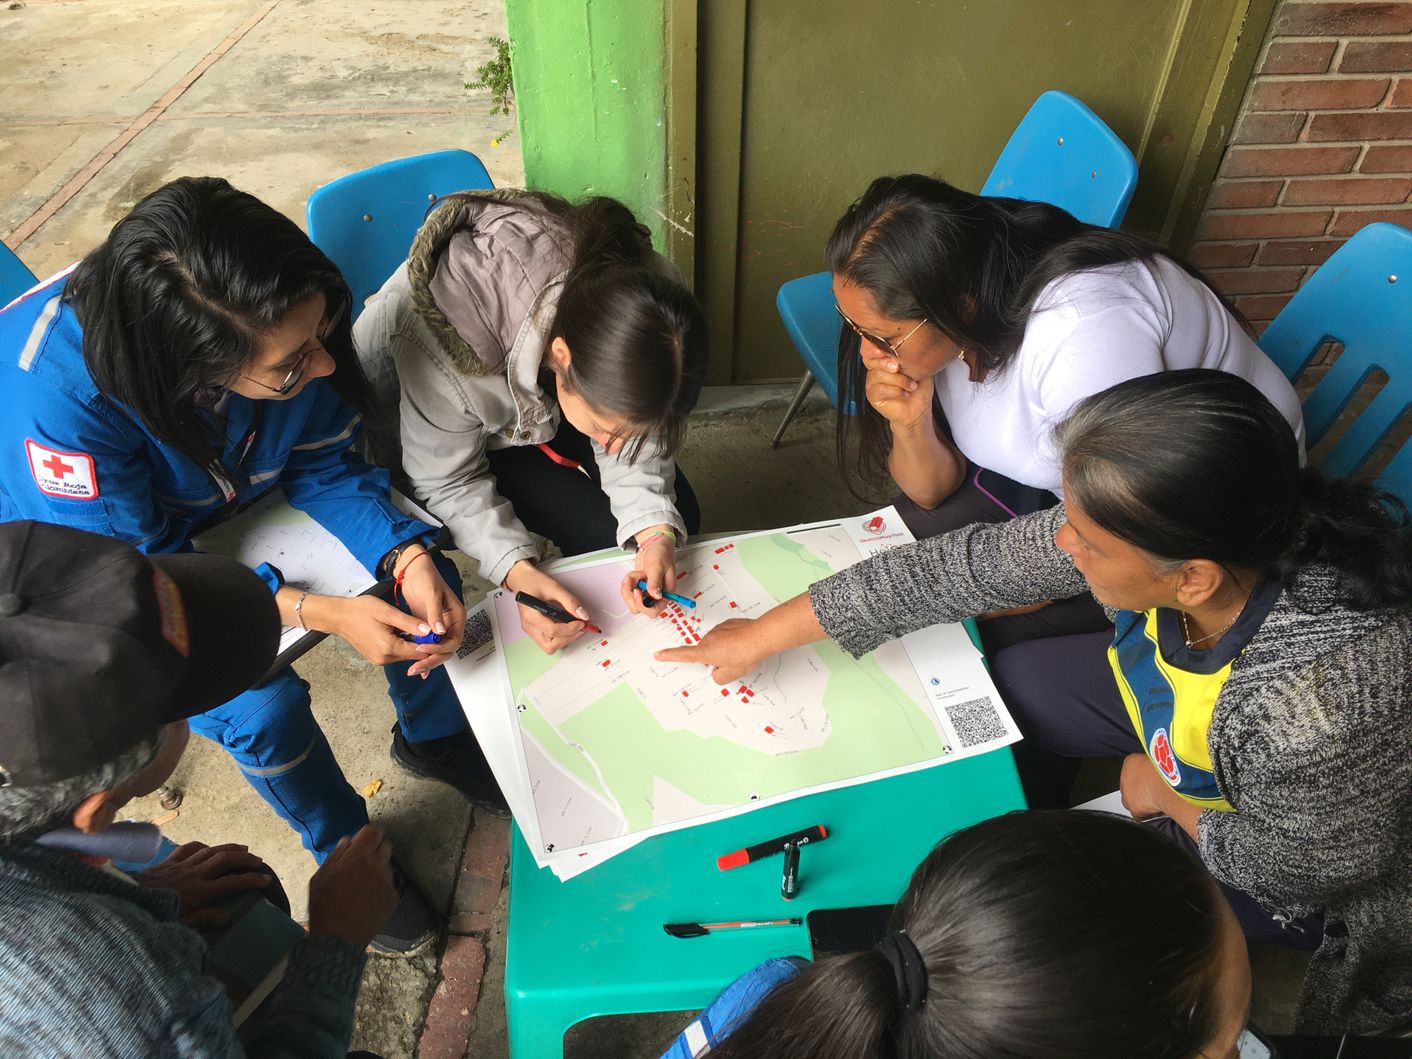
Community mapping, Source: Kimon Letzner
UN Mappers: Support peace and security with open mapping
Compared to other mapping organizations, UN Mappers is a relatively young community. UN Mappers is a community of mapping enthusiasts dedicated to collecting, validating, and disseminating open geospatial data to support decision-making processes with more accurate location-based data.
This initiative is part of the broader UN Maps project, which aims to enhance topographic and operational data in UN missions, thereby providing peacekeeping and humanitarian actors with better tools and information.
UN Mappers is open to everyone, inviting individuals worldwide to support peace and security through open mapping. The community ranges from UN personnel, such as GIS groups, UN offices, military, and police, to academia, local communities, NGOs, and remote volunteers.
Through the UN Maps Learning Hub, UN Mappers offers a self-training platform where participants can learn the basics of OpenStreetMap (OSM), understand its main editors, and map significant geographic features encountered in UN Peacekeeping mission territories. Additionally, the “Voice of the Community” page highlights exceptional mappers for their achievements and contributions.
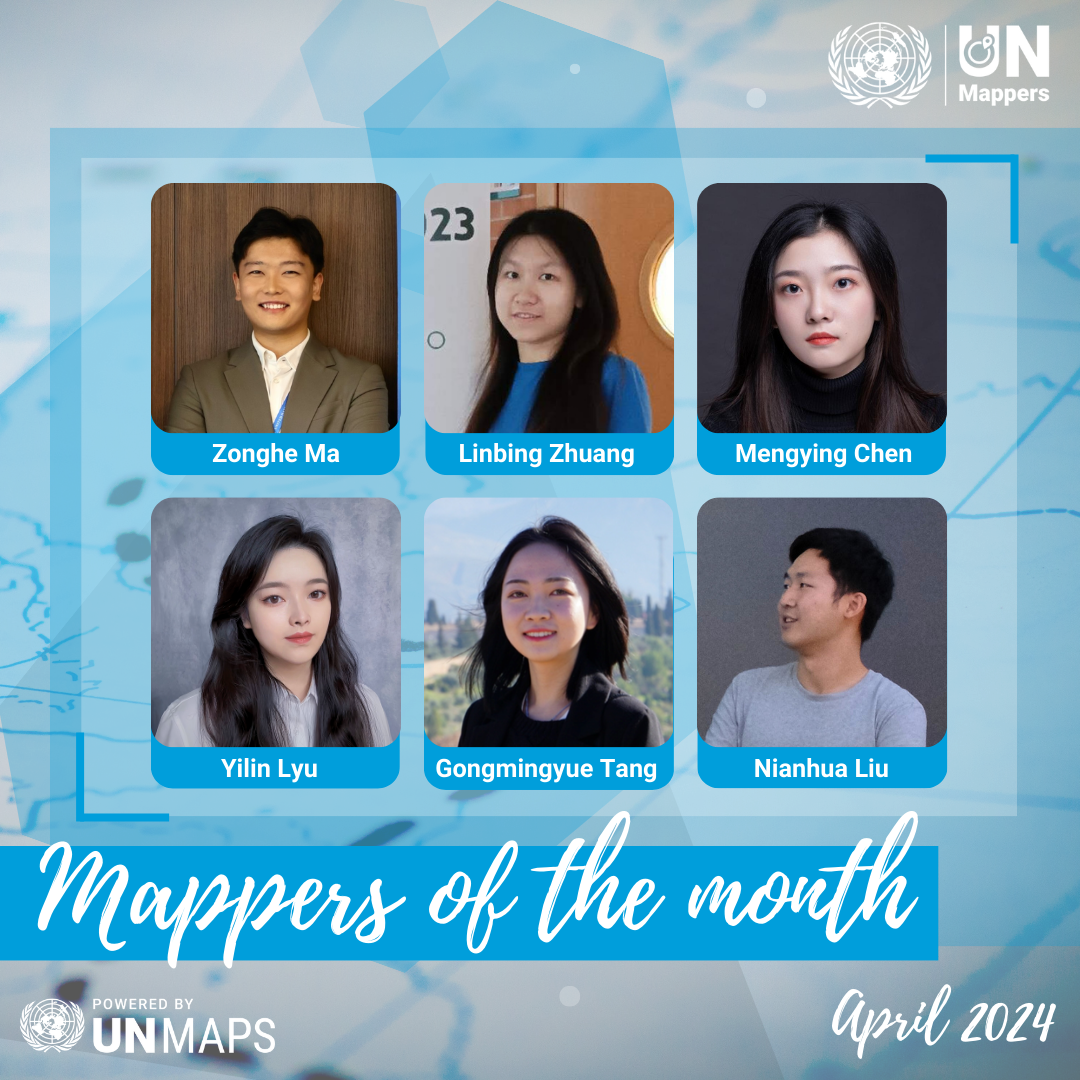
The UN Mappers of the month, Source: UN Mappers
How can you contribute?
Now that we’ve covered the relationship between OSM, HOT, and Missing Maps. The next question is: how can you contribute?
There are several ways you can get involved. If you are a beginner, learning materials from organizations like HOT or UN Mappers can help you get started. One of the most engaging ways to contribute is by participating in a mapathon.
This is a coordinated maping event where volunteers come together to create or improve maps of a specific area. Either online (armchair mapping) or in-person (field mapping), you’ll be able to trace satellite imagery to map roads, buildings, land use, etc. using tools like HOT’s Tasking Manager.
You can start by teaching yourself through self-paced guides like LearnOSM and UN Maps Learning Hub. However, participating in regularly organized Missing Maps mapathons, can be a more interactive and impactful way to get involved. Mapathons can be attended either in-person or virtually, and they often include a significant training element designed for beginners. These events are a great way to make a meaningful contribution to a specific humanitarian mapping project.
To find mapathons near you, check out the events section of the OSM Cal.
If you’re attending a mapathon for the first time, it’s helpful to review resources like “Missing Maps Mapathons – before the event” to get prepared.
By joining these efforts, you can play a crucial role in creating detailed maps that support humanitarian aid and disaster response, helping communities around the world.
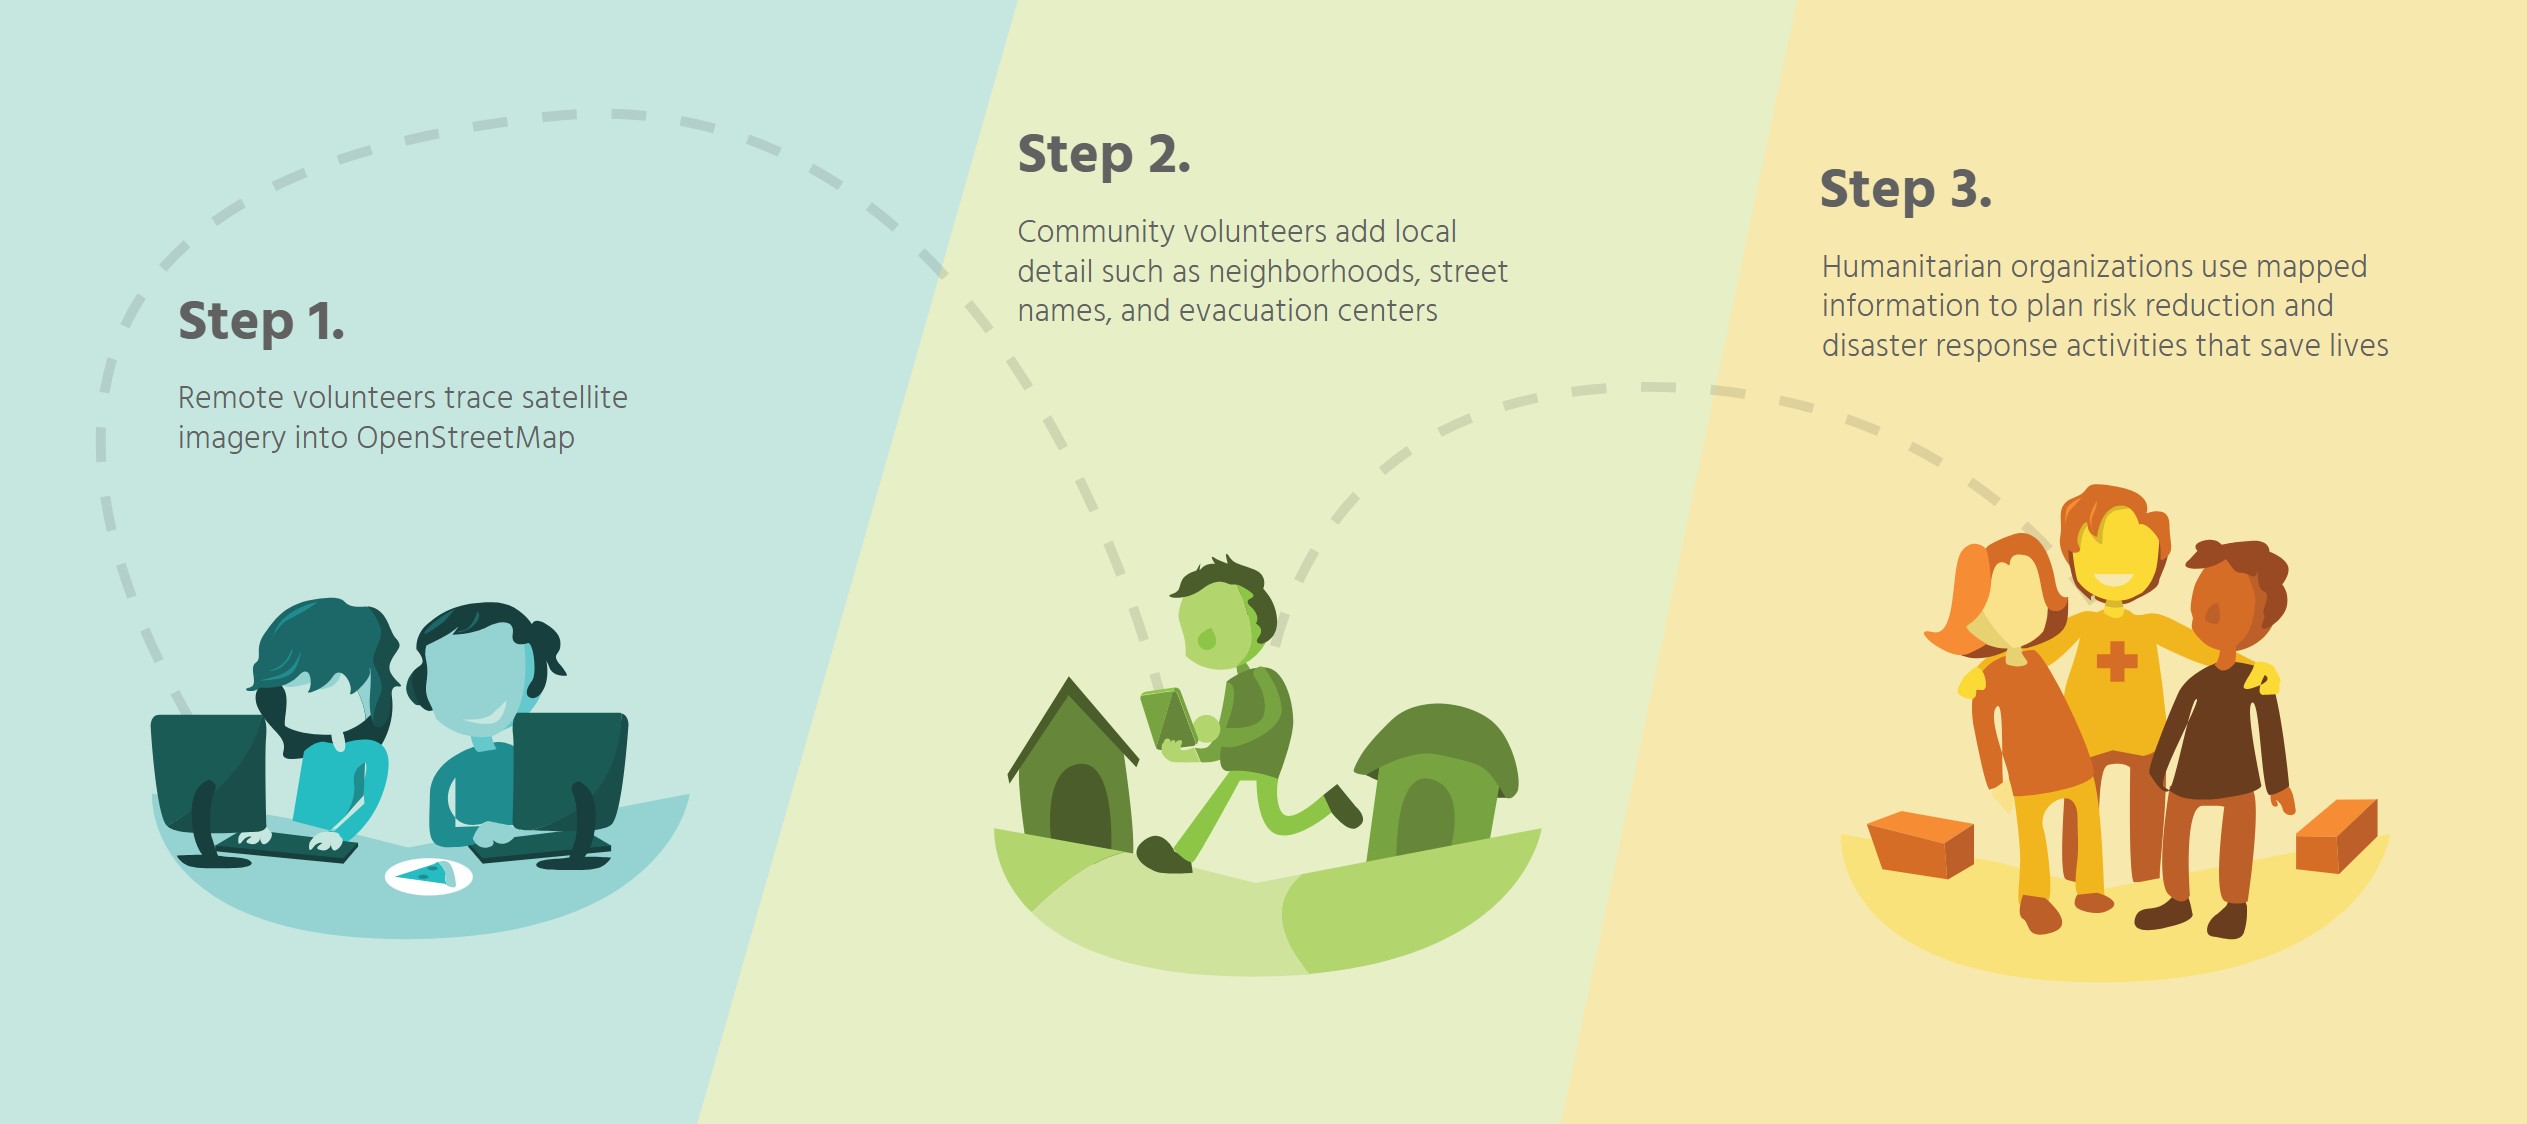
How Missing Maps work, Source: Missing Maps
Organizations based on PGI: The Efforts from Experts
Now that we’ve covered volunteer mapping, or VGI, how can you contribute as a geospatial professional, through PGI efforts?
This section introduces some PGI agencies such as Copernicus Emergency Management Service and MapAction, exploring who they are and how they differ from VGI initiatives. Let’s start with MapAction.
MapAction: Expert-Led Disaster Response Mapping
MapAction has positioned itself as a crucial player in the realm of emergency response, having contributed to more than 130 major emergency responses worldwide. Over the past 18 years, MapAction has provided vital mapping, data, and information tools to disaster relief agencies, aiding in responses to 11 significant earthquakes, including those in Haiti, Pakistan, Indonesia, and Nepal. The organization’s extensive experience has honed its ability to address the most urgent mapping and data needs of disaster response agencies.
The concept of MapAction was conceived by Rupert Douglas-Bate in 1994 while he worked as an emergency water engineer in Bosnia. He identified a critical gap in the availability of mapped analysis to support effective humanitarian aid planning and delivery. With the support of his father, Andrew, the charity was founded and initially registered as Aid for Aid.
The organization’s first deployment was in 2003 to Lesotho in response to a food security emergency, and in 2004, it conducted its first rapid response mission following the Indian Ocean tsunami, deploying a team to Sri Lanka. The UK-registered charity was one of the first foreign NGOs to arrive in Sri Lanka, deploying an 11-person team of highly skilled professionals to Colombo within hours of the tsunami.
MapAction’s team worked around the clock to collect detailed data and produce maps pinpointing hospitals, roads, affected families, casualties, missing persons, and more. Their maps enabled relief agencies to navigate areas, identify vulnerable people, and coordinate aid more effectively in the aftermath of the tsunami.
Since its inception, MapAction has grown significantly, currently consisting of around 25 staff members and 75 volunteers. The organization has adapted to modern challenges by leveraging remote volunteer efforts, thereby increasing productivity without significantly raising deployment costs.
MapAction continuously innovates to enhance its services for disaster-affected populations. The organization’s InnovationLab brings together data scientists, software developers, geospatial experts, and data engineers to develop anticipatory humanitarian action solutions.
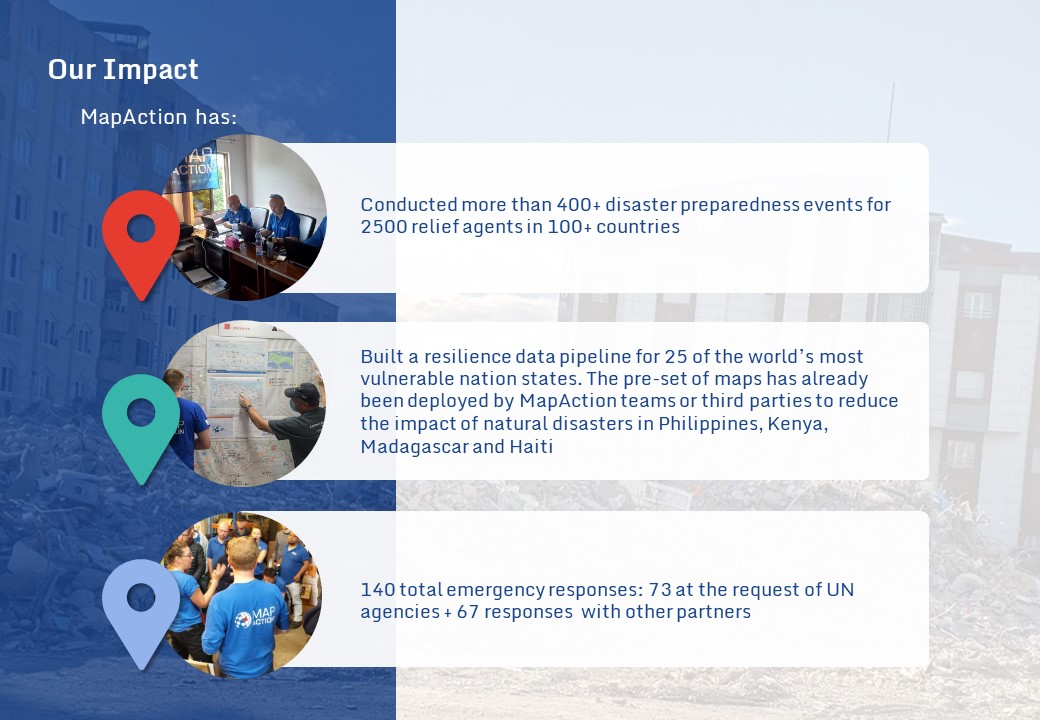
Impact of MapActions, Source: MapActions
Copernicus Emergency Management Service – Mapping
The Copernicus Emergency Management Service (CEMS) leverages satellite imagery and other geospatial data to provide free mapping services in response to natural disasters, human-made emergency situations, and humanitarian crises around the globe. As part of the larger Copernicus program—an EU initiative focused on developing European information services based on satellite Earth observation and in-situ data—CEMS supports various disaster management actors by delivering crucial geospatial information that enhances decision-making processes.
CEMS operates two main mapping services. The first, Rapid Mapping, provides geospatial information within hours or days following an activation to support immediate emergency management activities. This service produces several standardized products, including reference maps that offer quick knowledge of the territory and assets before an emergency, first estimate products that deliver rapid, rough assessments of the most affected areas, delineation products that detail the event’s impact and geographical extent, and grading products that evaluate the severity and spatial distribution of damage.
The second service, Risk and Recovery Mapping, supports disaster management activities beyond the immediate response phase, focusing on prevention, preparedness, disaster risk reduction, and recovery. This service offers products such as reference maps depicting pre-disaster situations, pre-disaster situation maps that assist in risk reduction and preparedness, and post-disaster situation maps that provide detailed impact assessments to support recovery efforts.
CEMS services are utilized by regional, national, European, and international entities involved in emergency management. However, only Authorized Users can trigger these services. Associated Users, including local entities, international governmental organizations, and NGOs, must coordinate with Authorized Users to access the services. The general public can access information about activations through the CEMS web portal but cannot directly trigger the service.
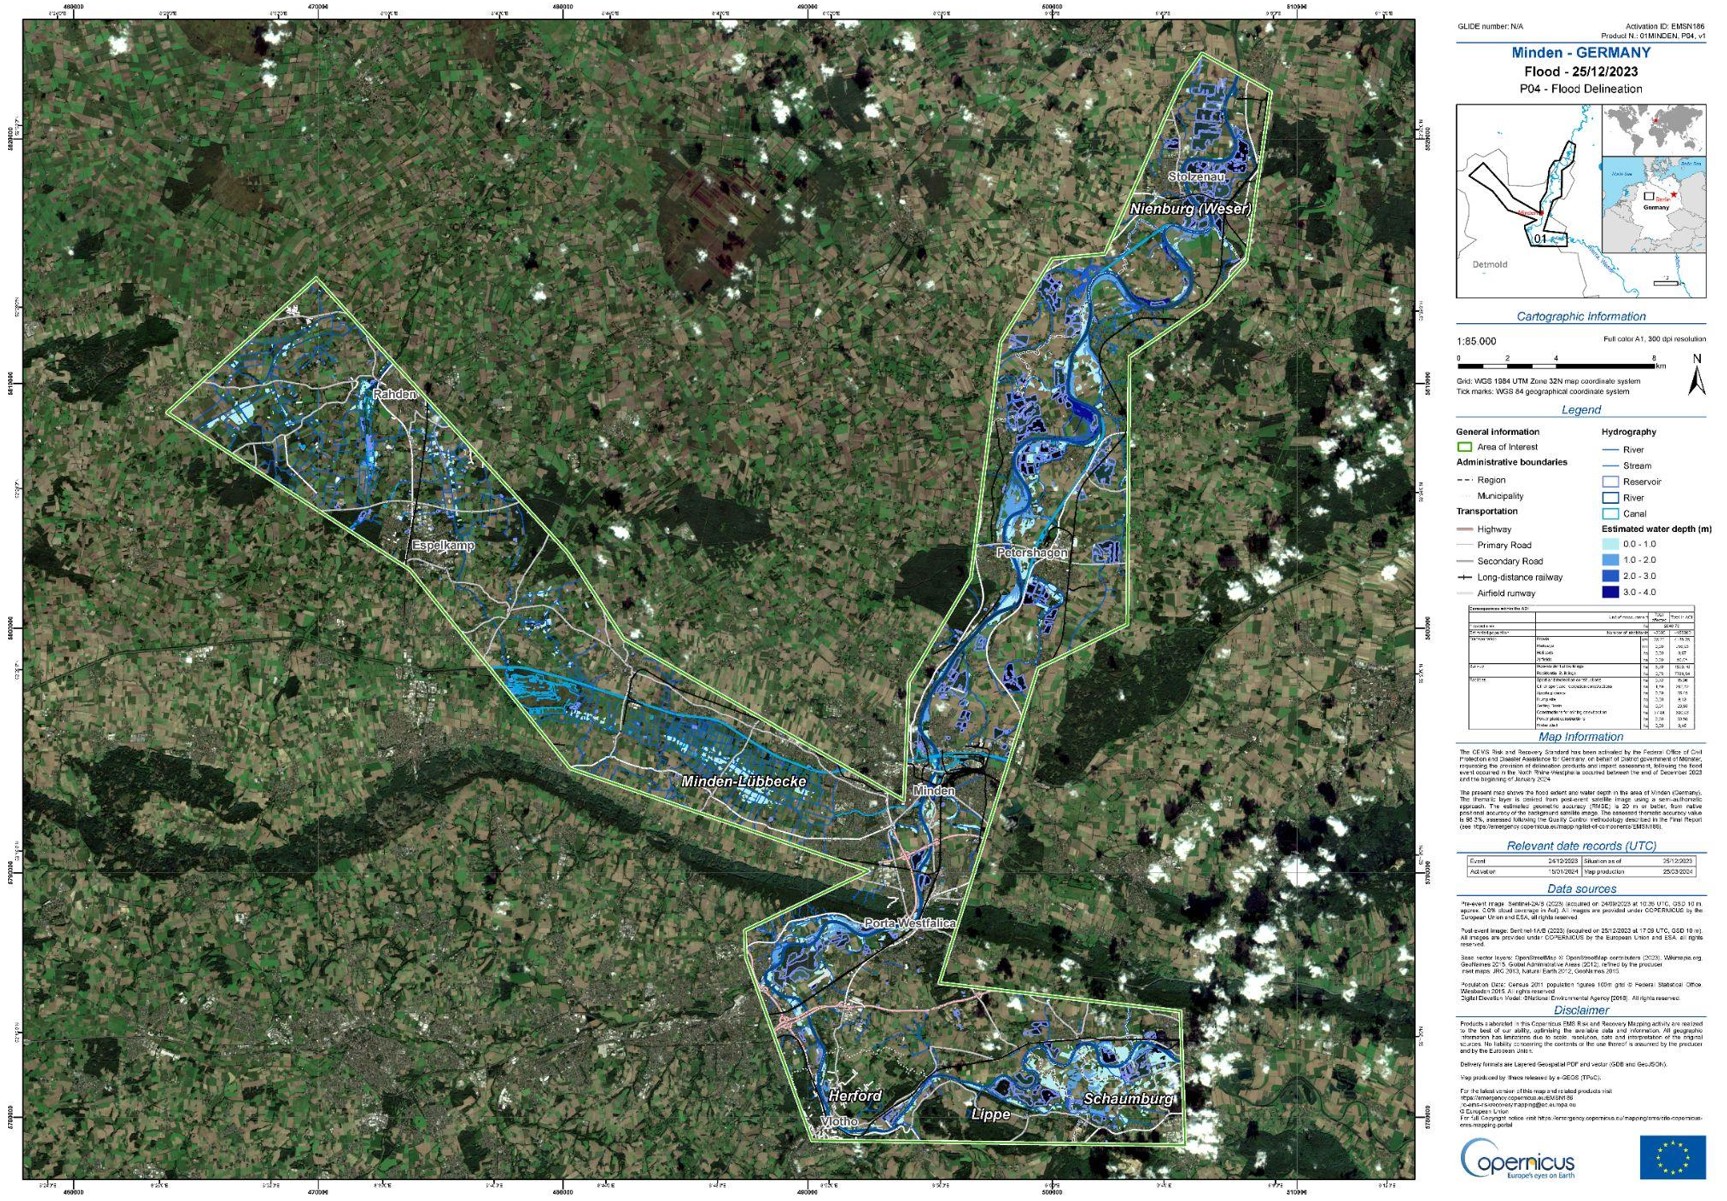
Flood in North Rhine-Westphalia, Germany, Source: CEMS
The Future of Geohumanitarian Services: AI and LLM
Looking ahead, the future of geohumanitarian services is poised to be revolutionized by the integration of Artificial Intelligence Generated Content (AIGC) and Large Language Models (LLM). These advanced technologies hold the potential to significantly enhance the efficiency and accuracy of mapping and disaster response efforts, offering faster data processing capabilities and more precise information.
LLMs have the potential to significantly improve emergency response by reducing the time and effort volunteers need to invest in tasks such as geocoding. By automating these labor-intensive processes, LLMs enable volunteers to focus on more critical aspects of mapping and data analysis. This shift not only speeds up the workflow but also ensures that emergency responses can be more agile and effective.
AI can also address the problem of data inequality. Currently, OpenStreetMap data exhibits significant disparities among different countries, with some regions having extensive mapping coverage while others remain largely unmapped. Humanitarian organizations often prioritize countries with the most substantial data gaps. AI can help bridge these gaps by automating the mapping process in underrepresented areas, ensuring that crucial geographic data is available where it is needed most.
Moreover, the use of AI to improve the processing and analysis of sensor data from sources like GPS devices will radically change the open mapping field. AI has the potential to exponentially accelerate mapping speed and capacity. For example, during a 2020 pilot project, HOT used AI to extract 18 million building footprints from satellite imagery, nearly doubling the mapping capacity to 2,500-3,000 buildings per person per day, compared to the 1,000-1,500 buildings per day achievable without AI.
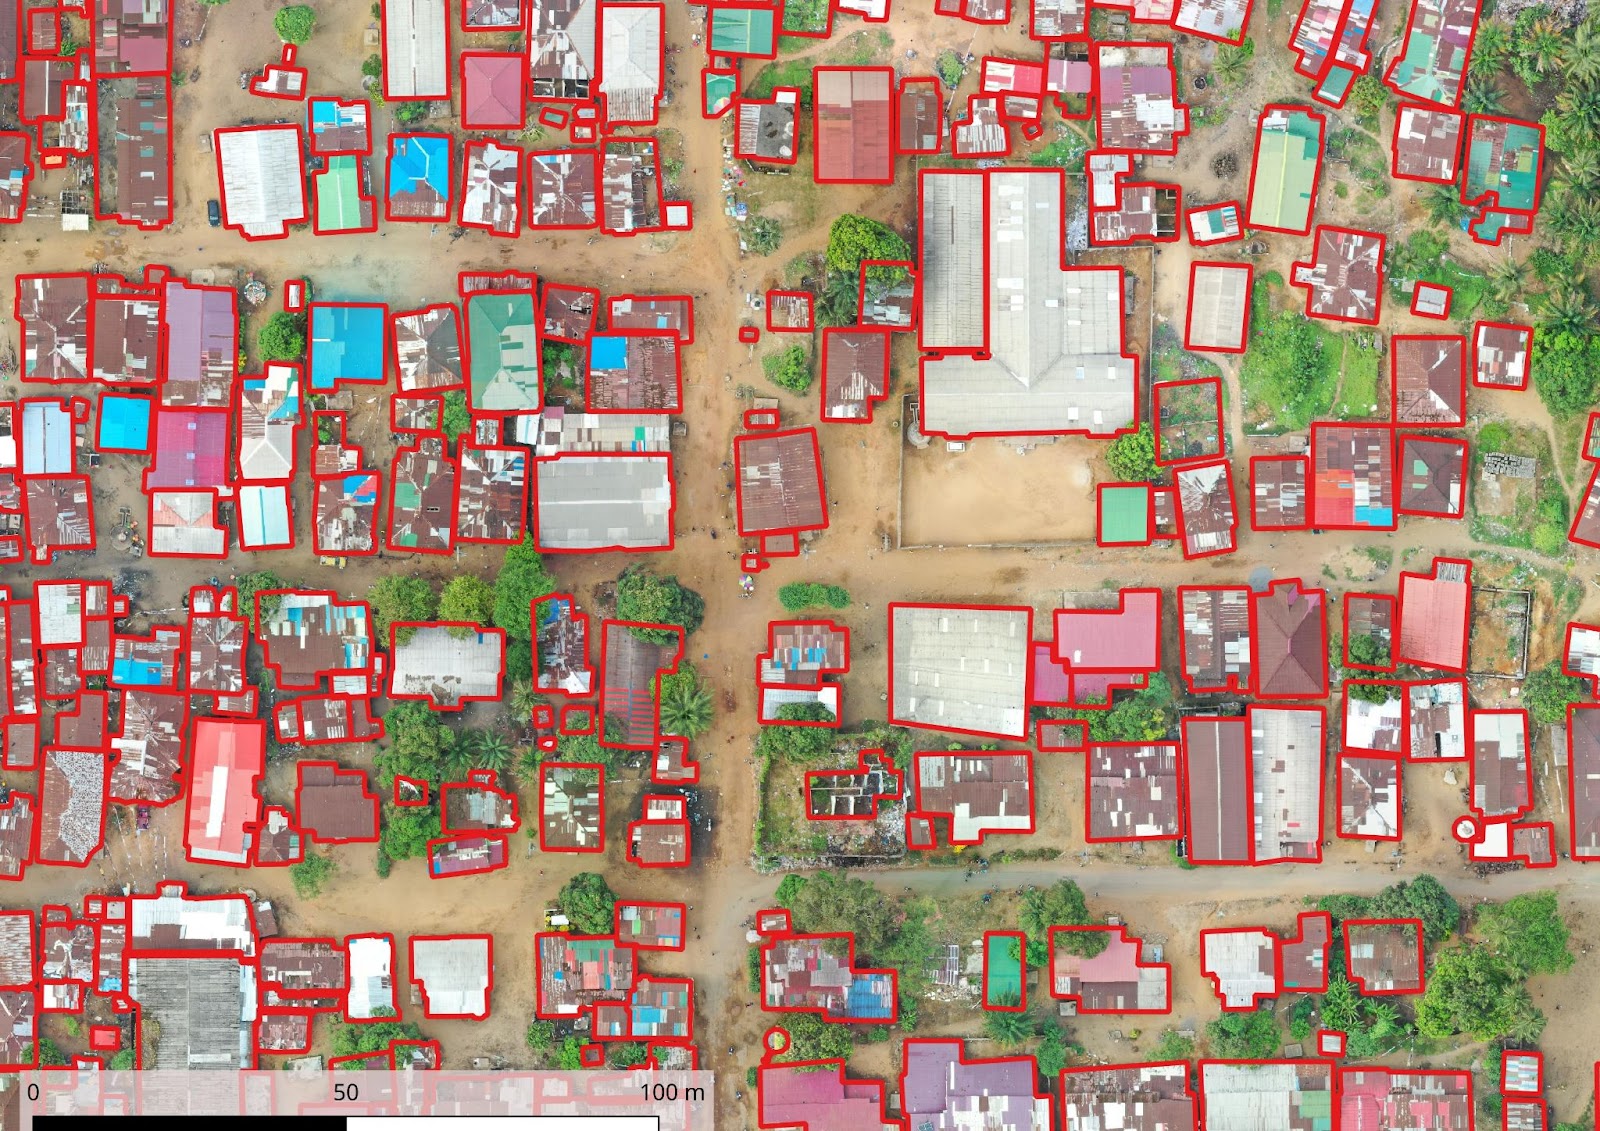
fAIr: An open AI-assisted mapping service that aims to improve the efficiency and accuracy of mapping efforts, Source: HOT
In conclusion, the future of geohumanitarian efforts will be significantly shaped by the adoption and integration of emerging technologies such as AI and LLM.
These innovations will enhance the speed, accuracy, and scope of mapping efforts, enabling more effective disaster response and better support for vulnerable communities worldwide. As these technologies continue to evolve, they promise to redefine the strategies and tools used in geohumanitarian services, making a profound impact on the field and ultimately saving more lives.
Did you like this article on GeoHumanitarian Mapping Organizations? Read more and subscribe to our monthly newsletter!

#Ideas

Next article
Exploring the World of Google Earth Engine Through Time-Series Visualizations
In the age of big data and cloud computing, Google Earth Engine (GEE) stands out as a handy environmental monitoring and analysis tool. This platform combines an extensive archive of satellite imagery with advanced capabilities, enabling researchers, policymakers, and geo enthusiasts to address some of the planet’s most pressing challenges.
Let’s examine the world of GEE, exploring its satellite imagery datasets in time-series visualizations!
GEE as a source of EO data
At the heart of Google Earth Engine lies its vast repository of satellite imagery. GEE hosts petabytes of data from various satellite missions, including Landsat, Sentinel, MODIS, and more. These datasets span decades, providing a rich historical perspective invaluable for long-term environmental monitoring.
The Google Earth Engine Catalog includes a comprehensive collection of satellite imagery, geospatial datasets, and environmental data from various sources. It provides access to datasets covering diverse topics like climate, vegetation, soil, water, and urban areas, enabling users to analyze and visualize changes over time. Multi-temporal data from satellite missions such as MODIS, Landsat, Sentinel, and more are organized into “ImageCollections” which contain a sequence of images over time for the same geographic area.
Visualizing Time-Series Data
Google Earth Engine allows users to create time series visualizations and export them as GIF files, enabling dynamic monitoring of environmental changes over time. Built-in charting capabilities to visualize time-series data extracted from ImageCollections enable visualizations such as line charts and animated visualizations to be created.
However, it’s important to note that some optical datasets in GEE can be affected by cloud coverage, which may obscure the visual data in certain frames.
Time series is crucial for analyzing trends, patterns, and seasonal variations over time, allowing for more accurate forecasting and decision-making in various fields such as agriculture, environmental science, and urban planning. It helps in identifying long-term trends, cyclical behaviors, and anomalies.
Example:
A. NDWI index
The Normalized Difference Water Index (NDWI) is an index used to measure and monitor water content in vegetation and the presence of water bodies. It is calculated using the near-infrared (NIR) and green wavelengths of light reflected by surfaces, with the formula:
NDWI = (G-NIR)/(G+NIR)
G is the green band and NIR is the near-infrared band.
In an image, you can plot the theNDWI time-series for a specific location to analyze the water content in vegetation and soil moisture. This makes it easier to distinguish between water bodies and land and is useful for tracking changes in water bodies, monitoring drought conditions, and managing water resources.
The two visualizations below show changes in water content in agricultural fields over a year. A significant change is noticeable in spring – an increase in humidity due to meltwater – and in summer, i.e. a time with less rainfall. Both areas are concentrated in areas with developed agriculture.
NDWI index, California, Jun 2022 – Jun 2023, Sentinel-2
NDWI index, Ebro River, Spain, Jun 2022 – Jun 2023, Sentinel-2
C. NDVI index
The Normalized Difference Vegetation Index (NDVI) is a widely-used remote sensing index that quantifies vegetation health and density by comparing the difference between near-infrared (which vegetation strongly reflects) and red light (which vegetation absorbs). It can be used for crop health monitoring or land classification.
The visualizations below show the change in the NDVI index over several months. The first concerns the area of Kenya and the impact of the rainy season on the increase in the vegetation index in the area of local national parks, including Mount Kenya (red dot on the green background). Interestingly, the vegetation map can indicate water reservoirs. In this visualization, they appear as black areas where the NDVI value is zero – these are Lake Naivasha and Lake Baringo.
The second visualization shows the NDVI index in an urban environment, in the city of Omaha in the USA. It can help in planning and arranging the city and examining the condition of trees in city parks and grasslands.
NDVI index, Kenia, Jan 2023 – Dec 2023, MODIS
NDVI index, Omaha, Iowa, Apr 2023 – Oct 2023, MODIS
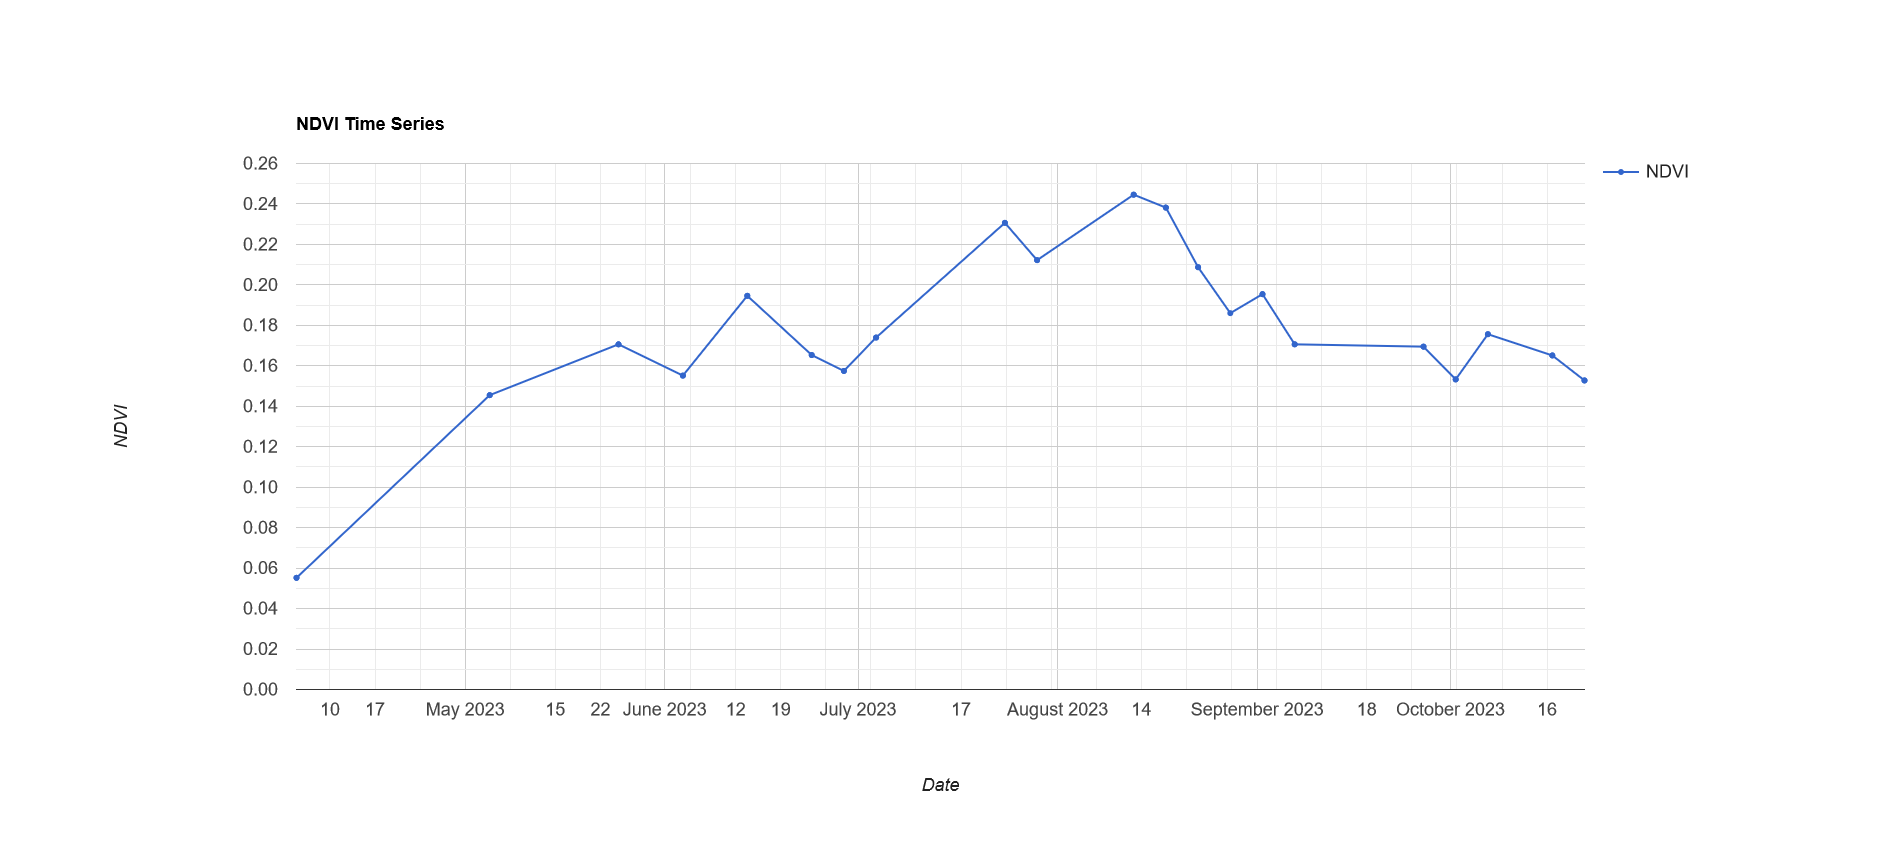
NDVI chart, Omaha
C. Optical imagery
Optical satellite imagery plays a role in observing and analyzing Earth’s surface by capturing images using visible and near-infrared light. For example, it is extensively used in urban monitoring to track city growth and infrastructure development, and in iceberg monitoring, such as tracking the formation and movement of icebergs, providing data for environmental and navigational safety.
The first of the visualizations below shows the Eye of the Sahara – a circular geological structure resembling a crater. Over time, even the desert area changes its face!
Eye of Sahara, 2018 – 2024, Sentinel-2
The next visualization is the effect of humans’ negative impact on global warming – the calving event in Antarctica. Iceberg A-83 was formed on May 20, 2024. Thanks to satellite imagery, it is possible to monitor such objects and provide early warning of such events.
Halloween Crack, Iceberg A-83 breaks
The latest visualization of satellite optical images reveals the agglomeration of Paris in 2020-2023. The use of such imagery is useful for urban planning and analysis of city development.
Paris agglomeration, 2020-2023, Sentinel-2
D. Radar imagery
Sentinel-1 radar imagery provides all-weather, day-and-night EO capabilities, making it invaluable for monitoring environmental changes, land cover, and emergency response activities. Its SAR technology is beneficial for mapping surface deformations, ice monitoring, and maritime surveillance due to its ability to penetrate clouds and darkness.
The time-series below showcases the movement of floating objects in the Upper Bay in New York in the period from 2020 to 2023. The detection capabilities of radar technology, regardless of the time of day or weather, are used to track objects and monitor changes on the earth’s surface.
Upper Bay, New York, 2020-2023, Sentinel-1
GEE for Everyone
One of Google Earth Engine’s most significant strengths is its accessibility. It is designed to be accessible to a wide range of users, not just traditional remote sensing experts.
Users can interact with the platform through a user-friendly web interface or programmatically using the GEE API, which supports multiple programming languages such as JavaScript and Python.
Additionally, GEE offers extensive documentation, tutorials, and an active user community, making it easier for newcomers to get started. When searching the Internet, you can find many studies of satellite data using GEE, which emphasizes the importance of this tool in the development of algorithms. Based on the EO Hub Report, approximately one-fifth of users use GEE in their daily work. This shows that it is a competitive tool for Esri products or open-source QGIS.
Conclusion
Google Earth Engine represents a monumental leap forward in our ability to understand and manage Earth’s environment. By combining a collection of satellite imagery with analytical tools, GEE enables us to tackle complex environmental challenges with efficiency and scale!
Getting back to time-series visualizations, which phenomena would you like to present using the Google Earth Engine?

