#Business

Winter is Here and it’s Geotagged: Mapping Game of Thrones Season 7 Premiere Tweets

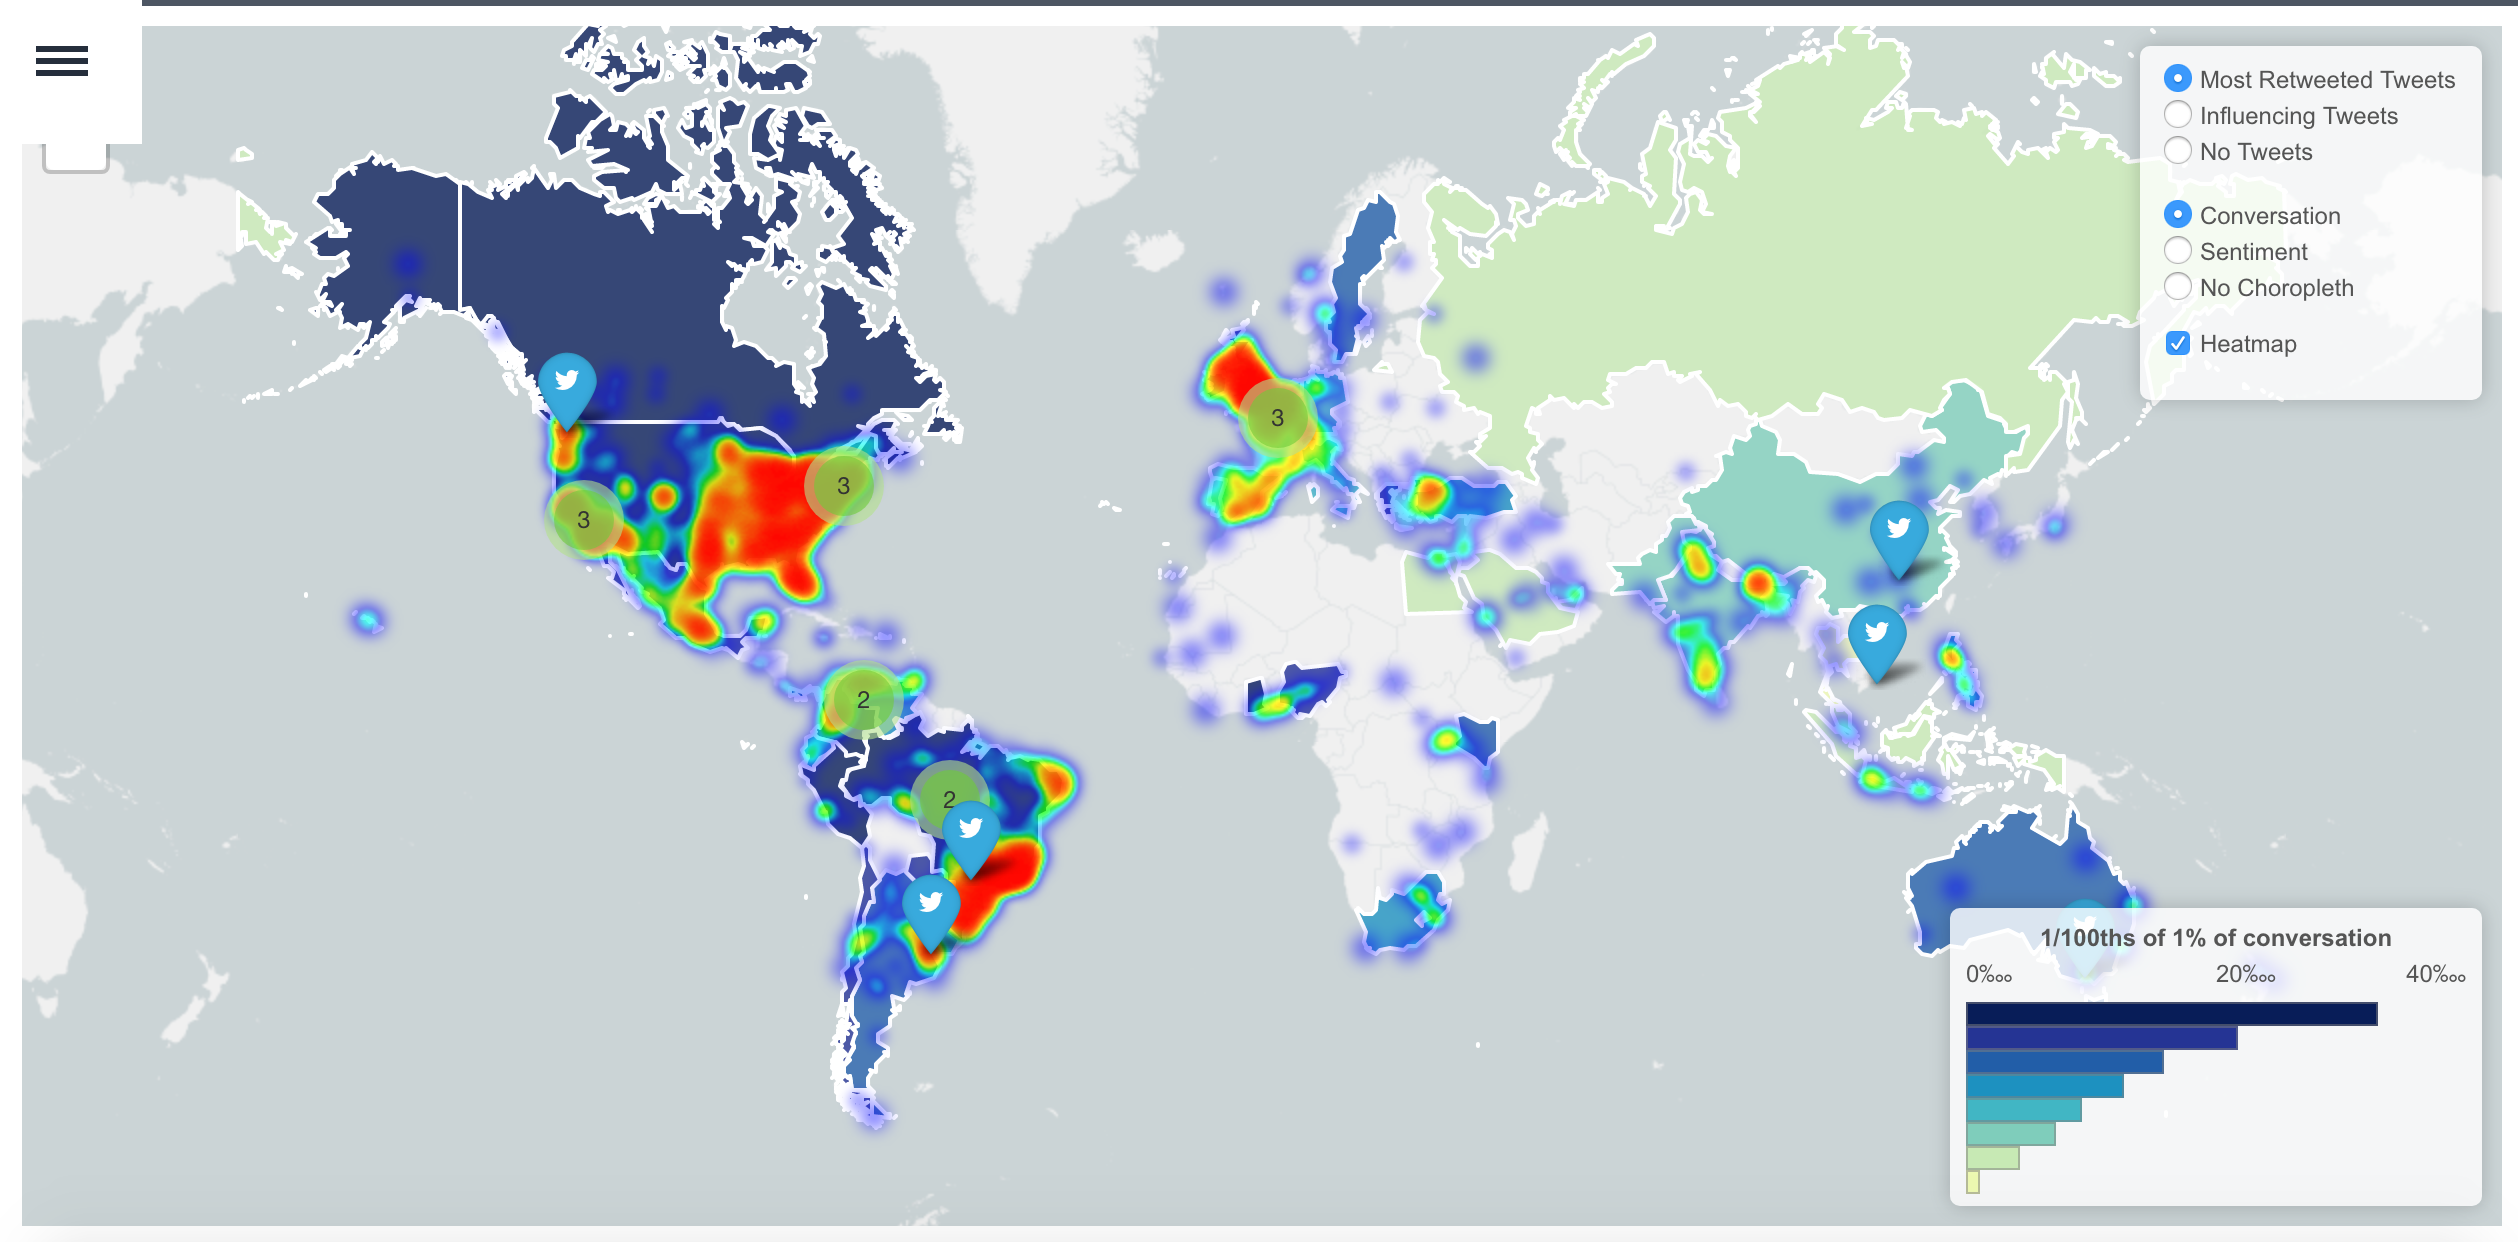
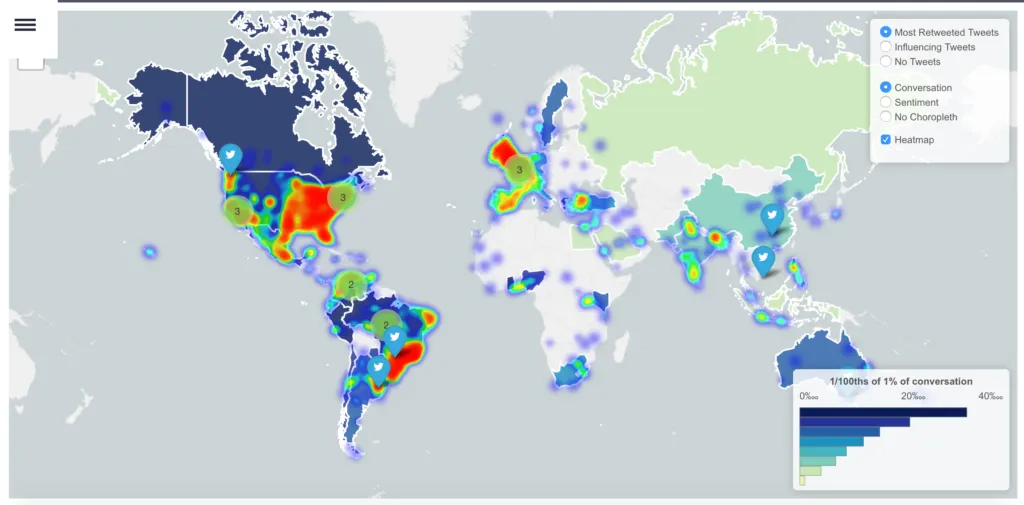
Most Retweeted “Game of Thrones” Tweets over 24 hour period Sunday, July 16th, 2017 from Trendsmap

It may be summer in the northern hemisphere but finally, after seasons of Starks shouting their battle cry and sashaying away, winter has finally come to Westeros. With it comes the beginning of the end of the series and the time to ponder whether the world will end in fire or ice.

Winter’s blustery arrival also brings a blizzard of internet activity, including five straight years of Game of Thrones being the most pirated show on television and a mountain load of memes that deluge the internet daily. As usual, I wanted to see where exactly these wintry winds of the world wide web were whirling strongest.

Twittersphere Tempest Strongest in the U.S., Brazil, & the U.K.

Most Influencing “Game of Thrones” Tweets over 24 hour period Sunday, July 16th, 2017 from Trendsmap

People were most prepared for winter in the United States (41%), Brazil (21%), the United Kingdom (6%), Argentina (4%), Mexico (3%), Colombia (2%), Canada (2%), France (2%), Turkey (1%), Venezuela (1%), India (1%), and the Philippines (1%), according to a 24-hour Trendsmap query of “Game of Thrones” tweets from the day of the premier. More specifically, the urban centers of New York (3%), São Paulo (3%), Rio de Janeiro (2%), London (2%), Los Angeles (2%), Chicago (1%), and Buenos Aires (1%) were the biggest contributors to the 479 thousand tweets that day.

Ed Sheeran’s Song Turned Time to Ice and Set the Internet on Fire

Twitter Timeline map of “Game of Thrones”, #gots7, #gameofthrones, and #winterishere tweets

Which moments of magic and manipulation created the greatest stir across the seven kingdoms? Because Game of Thrones occasionally causes worlds to collide just as it tears them apart, it often indulges crossovers involving famous British entertainers. This time, Ed Sheeran supplied his vocals in a cameo towards the end of the episode that froze time and set the internet on fire.

Twitter Battle for the Iron Throne; The Ladies are in the Lead

After riding dragons and Dothraki steeds across all of Essos, is there anyone with a more suitable posterior for the Iron throne than Daenerys Stormborn of the House Targaryen, First of Her Name, the Unburnt, Queen of the Andals and the First Men, Khaleesi of the Great Grass Sea, Breaker of Chains, and Mother of Dragons? Yet if her subjects or small council have trouble getting through Danny’s many titles, perhaps Jon Snow is a better bet. Or maybe, since Cersei is already in located in King’s Landing, she should continue her reign, if only for the sake of convenience.

Most Retweeted “Daeneyrs” Tweets over 24 hour period Sunday, July 16th, 2017 from Trendsmap

The people of the real and digital worlds were divided as to who they wanted as their next ruler, often split based on their hometown or motherland. Brazil (44%), the United States (23%), Argentina (4%), Venezuela (3%), and the United Kingdom (3%), specifically the cities of Rio de Janeiro (6%), São Paulo (6%), New York (2%), Recife (2%), and Belo Horizonte (2%) joined the unsullied behind Danny, spending support in the form of 89 thousand tweets.

Most Retweeted “Jon Snow” Tweets over 24 hour period Sunday, July 16th, 2017 from Trendsmap

The United States (40%), Brazil (21%), Argentina (6%), the United Kingdom (6%), and France (2%), especially New York (3%), Rio de Janeiro (3%), São Paulo (2%), London (2%), and Washington D.C. (2%) fought for the King in the North, adding 34.7 thousand tweets to his ranks.

Most Retweeted “Cersei” Tweets over 24 hour period Sunday, July 16th, 2017 from Trendsmap

Finally, the United States (41%), Brazil (31%), the United Kingdom (4%), Argentina (3%), and Venezuela (2%), particularly the metropolises of Rio de Janeiro (4%), São Paulo (4%), New York (4%), Washington D.C. (2%), and Los Angeles (2%) added their 63.9 thousand tweets to Cersei’s roar.

Regardless of where they were most loved, all of the potential successors to the crown were most celebrated during their respective screen time based on this interactive map.

Most filming in the U.K., Croatia, & Spain, but Didn’t Affect Tweet Volume

Map of Game of Thrones filming locations by country for entire series; locations from Google map supplemented with additional information from Telegraph article 

Because we’ve followed the somber, stoic Starks since season one, the U.K., especially Northern Ireland, overwhelmingly has the most filming locations (28), followed by Croatia (14), Spain (9), Iceland (7), Malta (5), and Morocco (3). Spain entered the high risk high, reward game of thrones around Season 4 when Dorne comes into the picture, but made up for lost time. Did studio sets spur locals to tweet support for characters and houses associated with filming locations? Or did they at least become more active on social media for the show in general as a result?

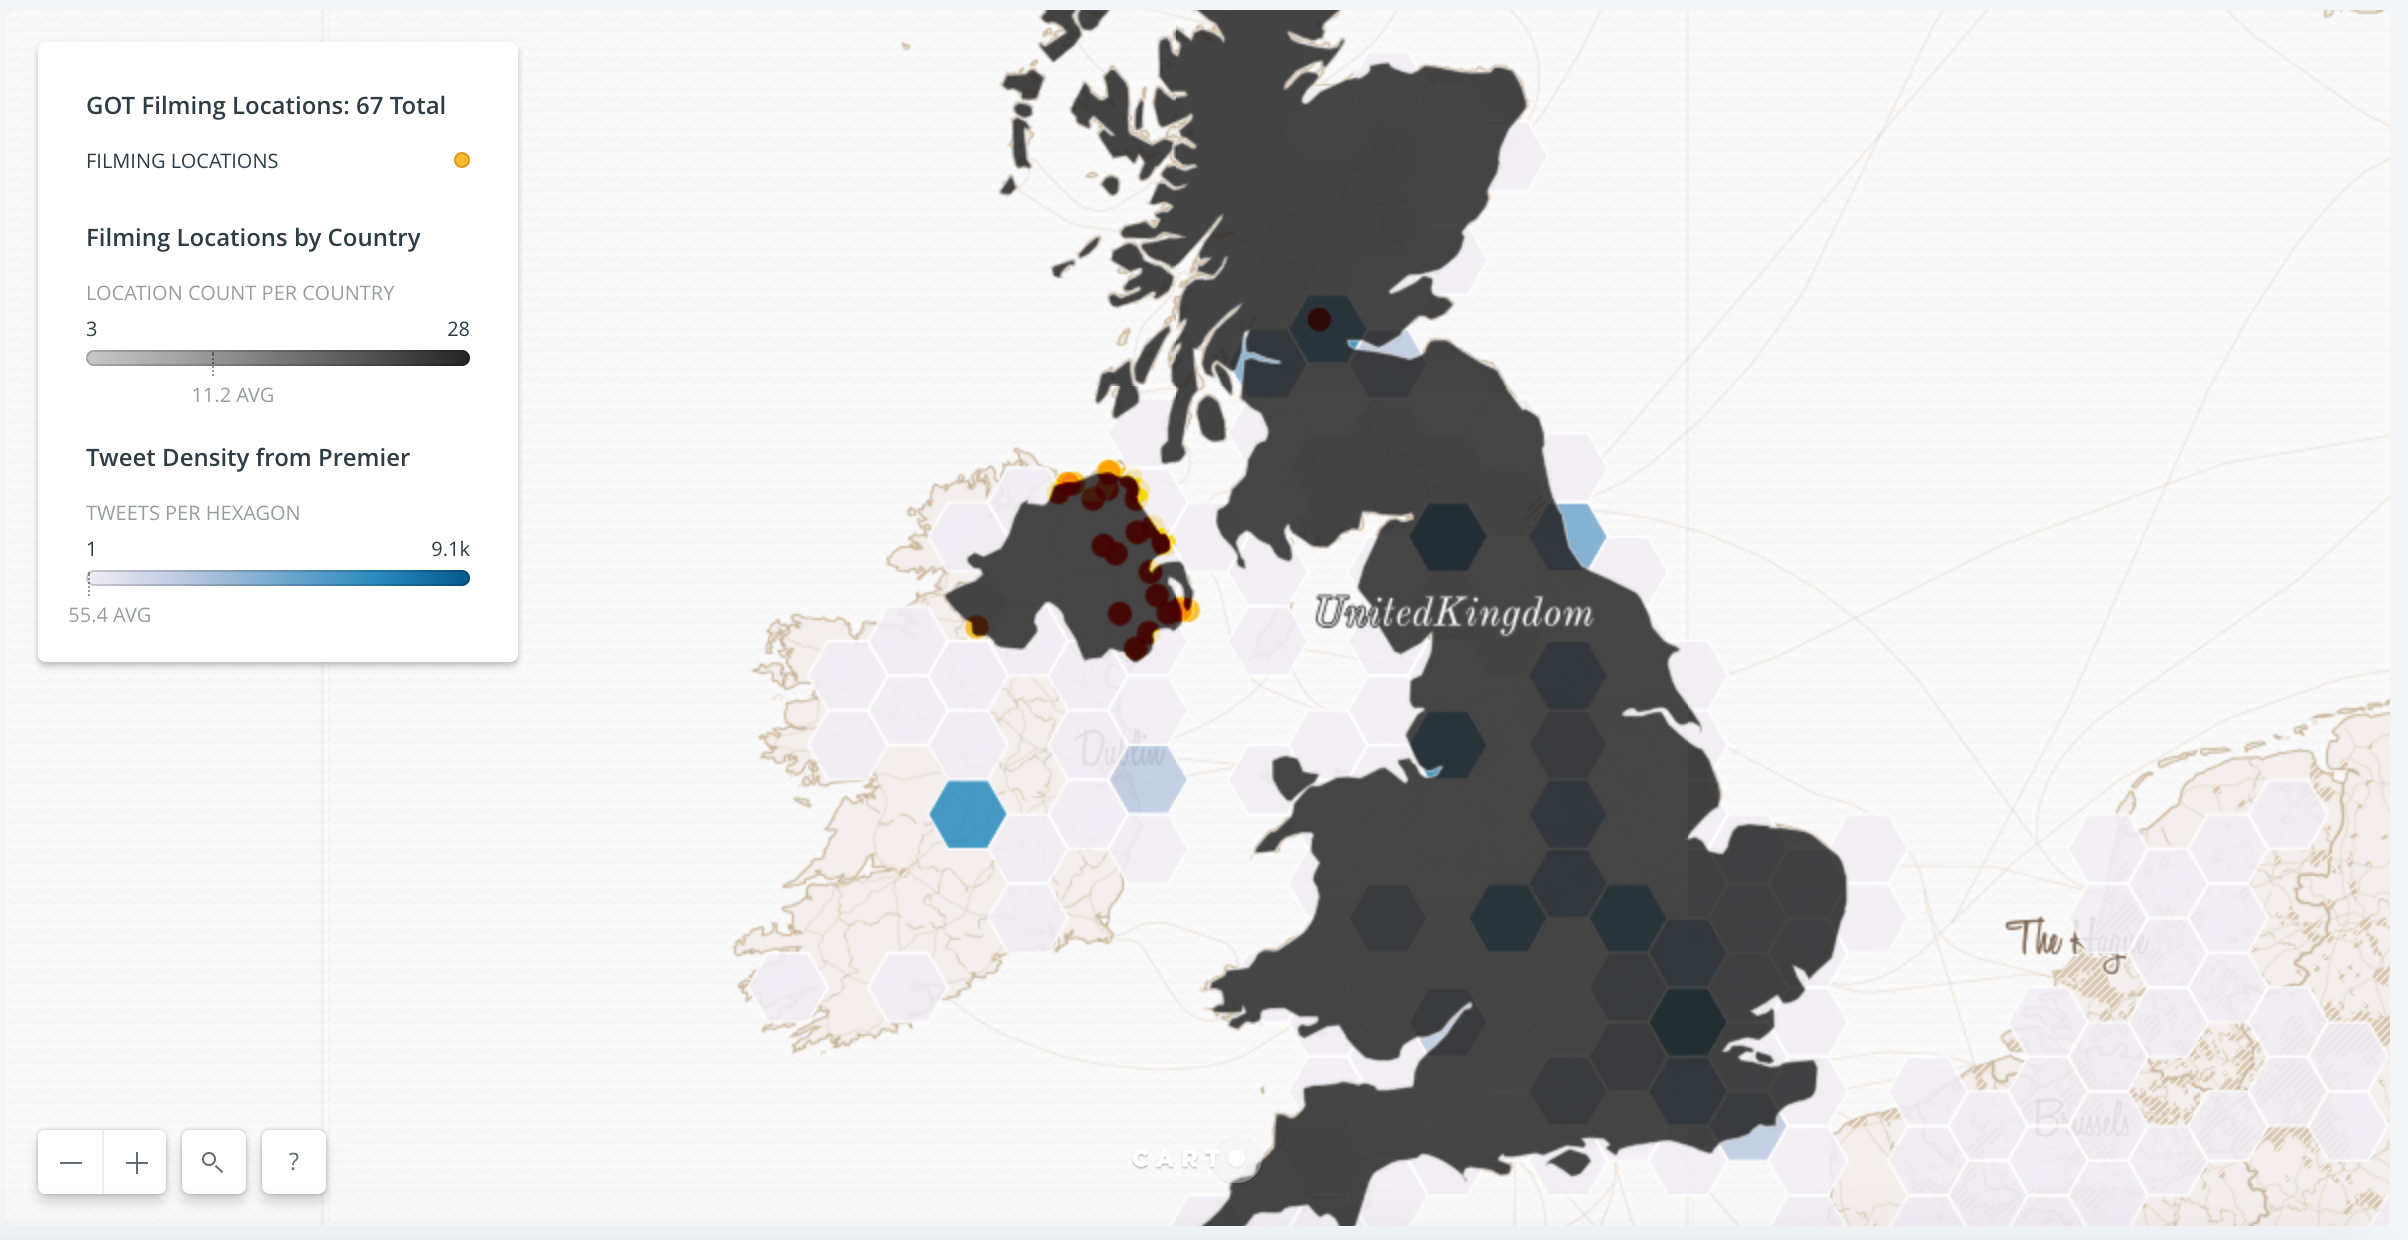
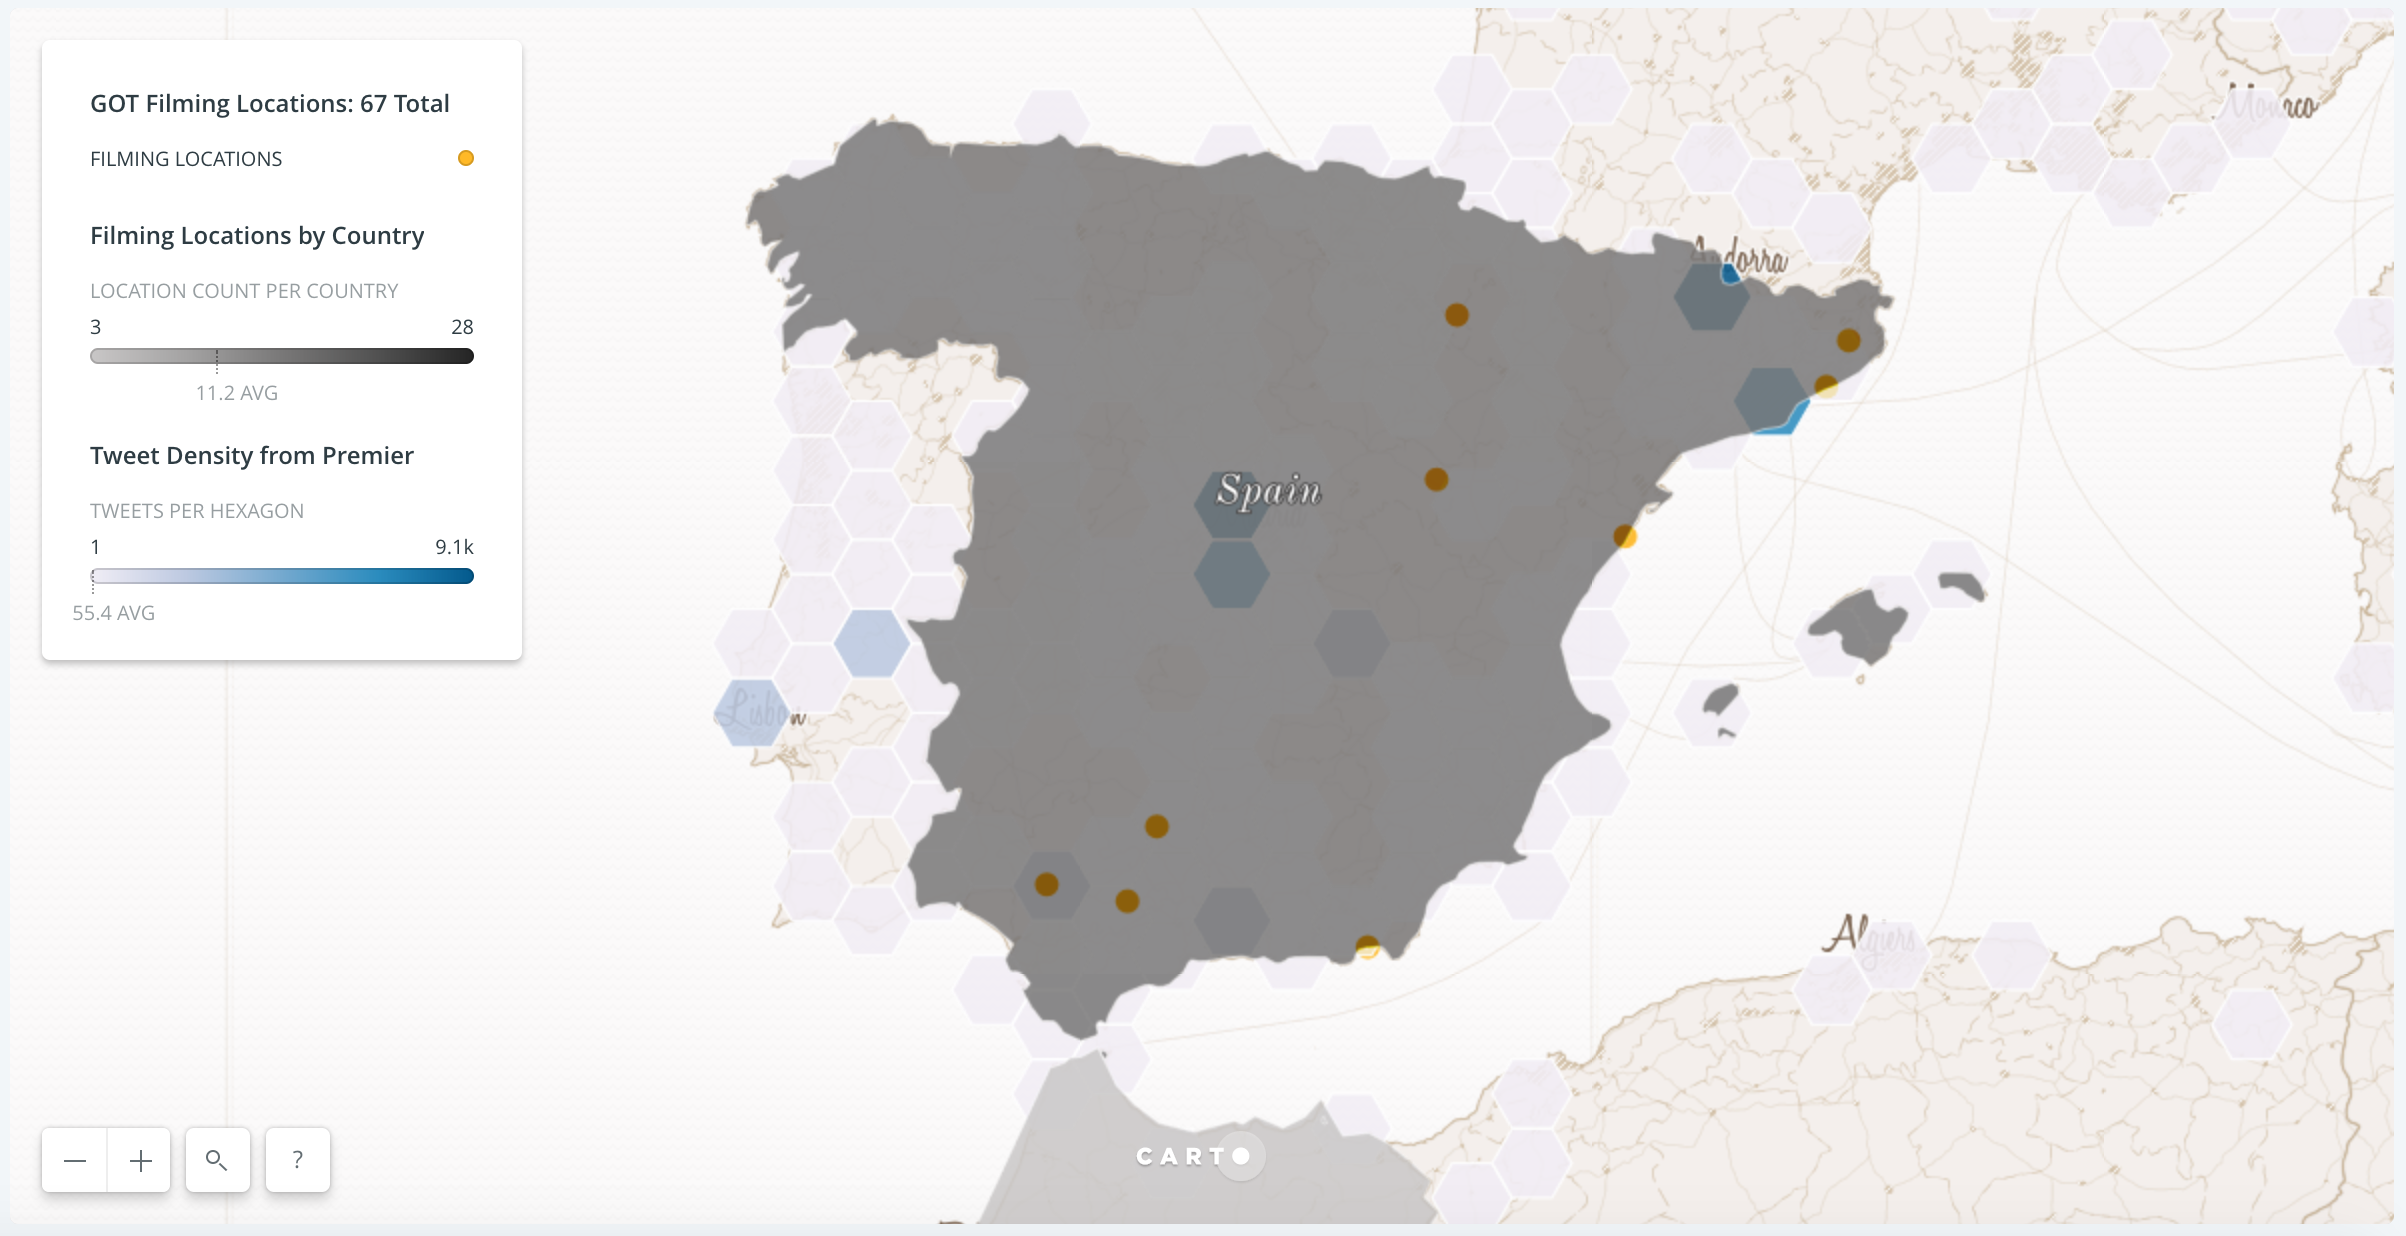
Maps of Spain and U.K. filming locations compared to tweet density

In the end, the interactive map revealed that Twitter volume (darker blue hexagons means higher tweet density) was far more related to proximity to large, connected cities and far less influenced by nearness to filming locations (orange points). For this reason, London far out-tweets the Northern Ireland locales and Madrid and Barcelona outnumber Andalusian areas on social media.

Black and Gay Twitter Dive into the Fray in the U.S. and  the Americas, Respectively

Just as Westeros is divided into houses for their respective kingdoms, so are American TV viewers divided into geographic groups. The New York Times identified “cities and their suburbs”, “rural areas”, and “the extended black belt” and the key players in the race for America’s iron throne, or couch. It also noted Game of Thrones as the fifteenth most socially and locationally divisive show out of the fifty most popular shows in the U.S., with its viewership concentrated in coastal cities and avoiding rural America; apparently “the only show involving zombies” to follow this trend.

But what does Twitter say? Black and gay subcultures are as sharp as Tyrion, charismatic as Daenerys, and ubiquitous as Varys’ little birds, especially when voicing views about popular culture on social media, so I wanted to listen for and map out their tweets. I focused on #ThronesYall, which usurped #DemThrones as the reigning Game of Thrones hashtag of Black Twitter last year. #GayOfThrones is an Emmy-nominated recap show, which sometime features actors from the HBO series, but it is likely also a rallying cry for thrones fans who are bearers of the rainbow flag.

Most Retweeted “Thrones Yall” Tweets over 24 hour period Sunday, July 16th, 2017 from Trendsmap

Cries of “Thrones Yall” echoed exclusively in English and boomed loudest across the United States (79%), with the greatest participation in New York (5%), Dallas (4%), Atlanta (4%), Tampa (3%), Houston (3%), Paris (2%), Johannesburg (2%), and Philadelphia (2%). Some key words usually accompanying their 980 cheers were “any” (47%), “targaryen”(47%), and “starks”(47%). Black Twitter seems to be rooting for the underdog rising up after oppression.

Most Retweeted “Gay of Thrones” Tweets over 24 hour period Sunday, July 16th, 2017 from Trendsmap

Gay Twitter is less tied to any one country or mother tongue and was most active in the United States (37%) and Brazil (23%), and most prevalent in the cities of Buenos Aires (5%), Porto Alegre (5%), São Paulo (3%), Belo Horizonte (3%), New York (3%), and Rio de Janeiro (3%). The LGBTQI Twitter community in the various Americas hailed from similar cities as Danny’s followers and likely appreciated that she can converse in multiple languages like high Valyrian. Similarly, they tweeted in different tongues such as English (69%), Spanish (19%), and Portuguese (12%). True to form, many of the most frequent words accessorizing the 490 “Gay of Thrones” tweets were clothing-related, including”mostrón” (17%), “mostron” (13%), and “remera” (12%).

Where are my dragons, wolves, and lions?

“Game of Thrones” Tweet heatmap over 24 hour period Sunday, July 16th, 2017 from Trendsmap

In the end, Twitter showed some serious lady love, didn’t care about filming locations, and was all about the cameos. As usual, subcultures played an important role in fandom and were geographically divided. Finally, as with the RuPaul’s Drag Race Season 9 Finale, the United States and Brazil were the biggest fans.

Are you #TeamDaenerys, #TeamJonSnow, or #TeamCersei?

Say thanks for this article (0)
The community is supported by:
Become a sponsor
#Business
#Business #Environment #Ideas #Satellites
China’s Smart Agriculture Boom Has Tech Potential but Requires Affordable Solutions
Nianhua Liu 05.9.2024
AWESOME 3
#Business #Contributing Writers #Fun #People
History of GIS | ESRI – A Pioneer in GIS Technology
Sebastian Walczak & Nikita Marwaha Kraetzig 07.26.2024
AWESOME 1
#Business #Featured
Global Top 100 Geospatial Companies 2025
GeoawesomeTeam 09.23.2024
AWESOME 5
Next article
#Business #Ideas

Location Based Services and Smart City Initiatives on a Global Scale

Location Based Services (LBS), when combined with data analytics and city demographics, has tremendous potential to tap into the pulse of the city and thereby improve the quality of life for citizens. The integration of LBS and Smart City Initiatives with city demographics and data analytics leads to better insights as well as enables city authorities to target the right people at the right time and at the right place. There are many international examples of LBS aided Smart City Initiatives proving the above statement.

This integration is a win-win for both citizens as well as the government authorities. Moreover, this will empower city authorities to gain better insights into citizen requirements and accordingly plan as well as disseminate city services. This, in turn, will increase citizen satisfaction levels, thereby improving city branding which will further attract businesses and improve city revenues. Listed are set of International Smart Cities that leveraged the Location Based services.Image on LBS and Smart City

Smart City Initiatives

Commitment to Sustainability

City and Country: City of Dubuque, Iowa, USA

Key Objective:

 • Energy efficiency and management

  • Checking water Proliferation

Description: Location-based sensors installed to trace the energy or water leakage and send its location to the concerned departments by geocoding it on GIS maps

Benefits or Impact: Rationalisation of energy consumption, demand Side energy management, water conservation, monitoring, savings, water surplus

Smarter safety Services

City & Country: Seoul, South Korea

Key Objective: Providing greater autonomy to children, the disabled, the elderly and Alzheimer patients

Description: Smart devices have been developed which utilise LBS to track children and the elderly when they move out of designated location boundary; integration with city CCTV network to track the exact location of missing member

Benefits or Impact: Family members and police department to be able to trace their missing members

Smart tourist Guide

City & Country: Nice, France

Key Objective: Updating local resident and tourists about the recreational and tourist spots

Description: Leveraging LBS and GIS, Nice delivered relevant information related to the tourist spots, buses, guest houses and hotels to its residents; tourists are also informed when they enter the city boundary

Benefits or Impact: Availability of relevant information on the current travel location

Crime mapping and smart policing

City & Country: Lincoln/ Nebraska, USA

Key Objective: Crime mapping, Hotspot generation, crime trend

Description: Tracking the locations of different type of crimes and offenders by LBS and geocoding them in GIS maps to generate crime map and hotspots for smarter policing

Benefits or Impact: Proactive crime detection, rationalised police van allocations, efficient surveillance and tracking

City control Centre

City & Country: Rio De Janeiro, Brazil

Key Objective: A comprehensive platform for the storage and analysis of meaningful data, monitoring operations and the evolution of incidents

Description: Collecting city level data through different sensors, analysing the data and hence utilising LBS to update users about the city level information such as sudden climatic change, no-entry, traffic congestion, etc. according to their locations

Benefits or Impact: Government has optimised its operation at the city level and can set priority order and alerts to create emergency command; also, the citizens are updated about city information on-the-go

On-the-go Parking

City & Country: Barcelona, Spain

Key Objective: Improved, efficient and sustainable urban parking

Description: Using LBS and superimposing it on GIS maps to update user about the nearest parking availability

Benefits or Impact: Citizens are updated with real-time parking information based on their locations

Smart business Profiling

City & Country: Pan America           

Key Objective: Optimal business location identification based on trends, preferences and opt-ins

Description: Determining location demography, preferences, opt-ins through LBS; this information is then utilised for location profiling for setting up of business

Benefits or Impact: Selection of a prime and optimal business location, thus ensuring profitability and success

Wait-less bus system

City & Country: Dublin, Ireland

Key Objective: Improved bus transit system, information regarding the buses’ waiting time and optimal route

Description: Integrating location based geo-spatial data and buses timetable into a central GIS thus creating a dashboard; then utilising this dashboard and tracking real-time data information about bus timings; GIS also helped in

Benefits or Impact: Efficient management of bus flow and detailed information about bus availability to citizens

Smart urban Platform

City & Country: Copenhagen, Denmark

Key Objective: Collection of city level data through pancity sensors; Analysing LI for different sources for better city management

Description: Utilising location intelligence of all city-level sensors, analysing varied location-based information from mobile phones, GPS in buses and cars to resolve issues ranging from congestion on roads, air pollution, water logging and efficient solid waste management

Benefits or Impact: Availability of integrated and improved public services, efficient pollution, water and solid waste management

Smart healthcare

City & Country: Pan Europe

Key Objective: Leveraging LBS and Wi- Fi to provide Emergency medical services to the citizens

Description: Under a healthcare programme called Caalyx a wearable device has been created which will measure special vital signs of the citizens and communicating with the healthcare services by sending the geographic location thus leveraging location intelligence

Benefits or Impact: Provisioning of prompt and on-the-spot medical services; ailing person benefited with greater autonomy

Smart citizen Services

City & Country: Tel Aviv, Israel

Key Objective: Providing tailored specific location through collaboration and crowd sourcing

Description: Crowdsourcing location-based information from citizens and integrating it with cloud applications so that it can be accessed by others

Benefits or Impact: Availability of information related to different events and activities across the city, encouraging more participation from citizen

Collective energy harvesting

City & Country: London, UK

Key Objective: Tracking citizens who are either walking or using cycles, decrease in pollution

Description: Citizens can make their presence felt LBS, they can be a part of the London Cloud if they are either walking or cycling, thus being the part of collective energy harvesting

Benefits or Impact: Motivated citizens to use walking and cycling as a mode of transport; zero carbon footprint

e-Governance

City & Country: Los Angeles, USA

Key Objective: City services to be delivered online, online complaint lodging

Description: Leveraging location-based information dissemination to map city services and analyse complaints registered online through location-based pictures and videos

Benefits or Impact: Availability of city services information with the citizens, quick and prompt grievance redressal

Smart disaster management

City & Country: Haiti

Key Objective: Prompt Emergency service, location identification, efficient rescue operation

Description: Using LBS as a base, Ushahidi created an app which was used by the Haiti earthquake survivors to identify their location and convey them to rescue and relief workers; GIS mapping was also used to locate the nearest open area for setting up base camps

Benefits or Impact: Millions of lives saved as locations were identified on a real-time basis and quick relief facilities such as food and water were provided

Read on
Search