
Each year, on a Sunday at the end of January or beginning of February, tens of millions of Americans declare their unofficial holiday. More than half the adult population in the US watch The Super Bowl, which determines the championship of American football.
The maps and charts below try to capture an essence of this fantastic event.
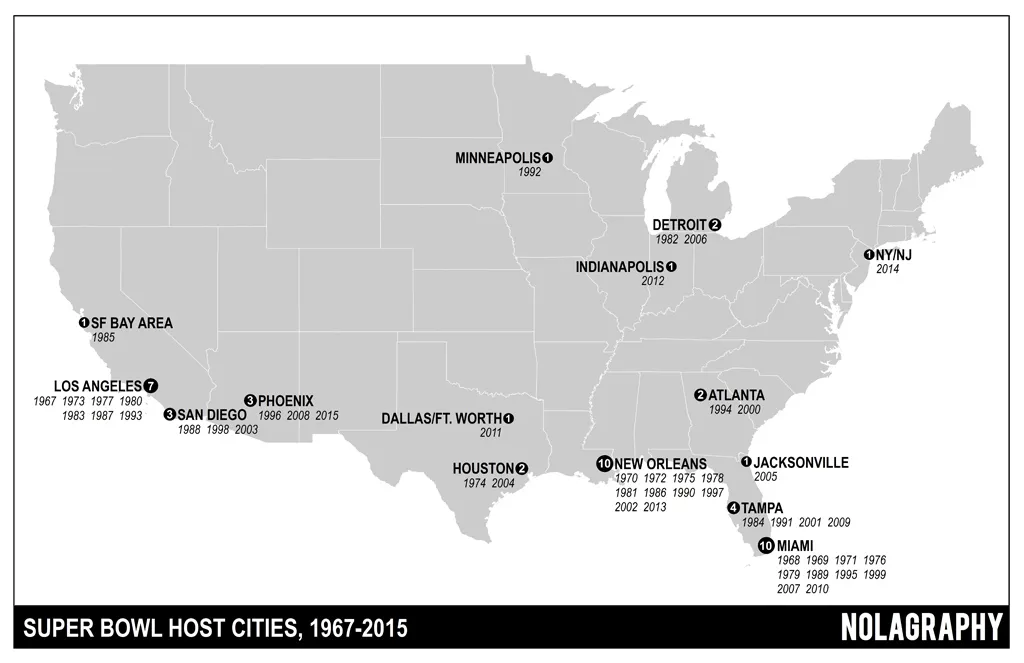
1. Super Bowl host cities 1967-2015

source: nolagraphy
2. Map of NFL Fandom
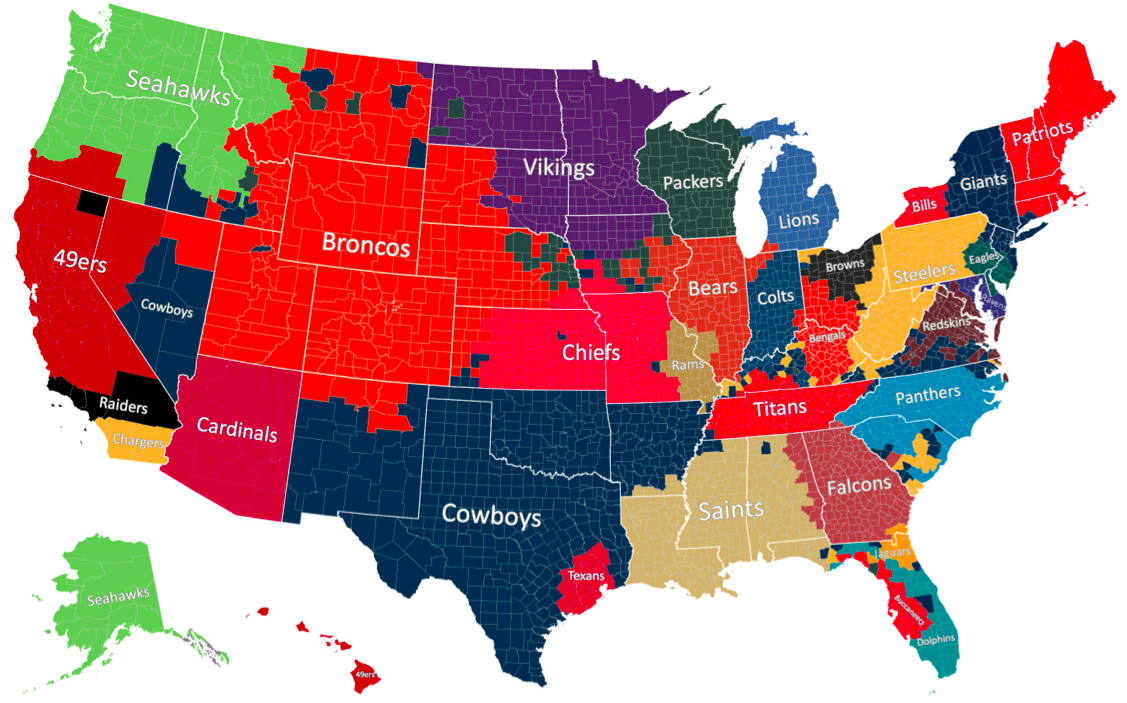
Each county is color-coded based on which official team Facebook fan page has the most ‘Likes’ from people who live in that county.
source: The Atlantic
3. Number of Super Bowl championships per NFL teams
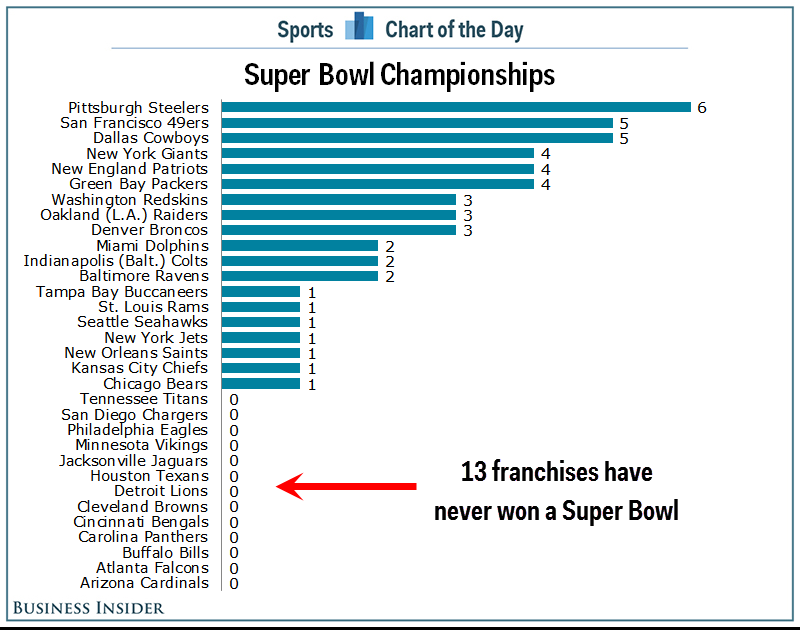
source: Business Insider
4. List of Super Bowl Winners 1967-2017
| Year | No | Winner | Loser | Score | Venue |
| 2017 | 51 | New England Patriots | Atlanta Falcons | 34-28 | Houston |
| 2016 | 50 | Denver Broncos | Carolina Panthers | 24–10 | Santa Clara |
| 2015 | XLIX | New England Patriots | Seattle Seahawks | 28-24 | Arizona |
| 2014 | XLVIII | Seattle Seahawks | Denver Broncos | 43-8 | New jersey |
| 2013 | XLVII | Baltimore Ravens | San Francisco 49ers | 34-31 | New Orleans |
| 2012 | XLVI | New York Giants | New England Patriots | 21-17 | Indianapolis |
| 2011 | XLV | Green Bay Packers | Pittsburgh Steelers | 31-25 | Texas |
| 2010 | XLIV | New Orleans Saints | Indianapolis Colts | 31-17 | Miami |
| 2009 | XLIII | Pittsburgh Steelers | Arizona Cardinals | 27-23 | Tampa |
| 2008 | XLII | New York Giants | New England Patriots | 17-14 | Arizona |
| 2007 | XLI | Indianapolis Colts | Chicago Bears | 29-17 | Miami |
| 2006 | XL | Pittsburgh | Seattle | 21-10 | Detroit |
| 2005 | XXXIX | New England | Philadelphia | 24-21 | Jacksonville |
| 2004 | XXXVIII | New England | Carolina | 32-29 | Houston |
| 2003 | XXXVII | Tampa Bay | Oakland | 48-21 | San Diego |
| 2002 | XXXVI | New England | St Louis | 20-17 | New Orleans |
| 2001 | XXXV | Baltimore | NY Giants | 34-7 | Tampa |
| 2000 | XXXIV | St Louis | Tennessee | 23-16 | Atlanta |
| 1999 | XXXIII | Denver | Atlanta | 34-19 | Miami |
| 1998 | XXXII | Denver | Green Bay | 31-24 | San Diego |
| 1997 | XXXI | Green Bay | New England | 35-21 | N Orleans |
| 1996 | XXX | Dallas | Pittsburgh | 27-17 | Tempe |
| 1995 | XXIX | San Francisco | San Diego | 49-26 | Miami |
| 1994 | XXVIII | Dallas | Buffalo | 30-13 | Atlanta |
| 1993 | XXVII | Dallas | Buffalo | 53-17 | Pasadena |
| 1992 | XXVI | Washington | Buffalo | 37-24 | Minneapolis |
| 1991 | XXV | NY Giants | Buffalo | 20-19 | Tampa |
| 1990 | XXIV | San Francisco | Denver | 55-10 | N Orleans |
| 1989 | XXIII | San Francisco | Cincinnati | 20-16 | Miami |
| 1988 | XXII | Washington | Denver | 42-10 | San Diego |
| 1987 | XXI | NY Giants | Denver | 39-20 | Pasadena |
| 1986 | XX | Chicago | New England | 46-10 | N Orleans |
| 1985 | XIX | San Francisco | Miami | 38-16 | Stanford |
| 1984 | XVIII | LA Raiders | Washington | 38-9 | Tampa |
| 1983 | XVII | Washington | Miami | 27-17 | Pasadena |
| 1982 | XVI | San Francisco | Cincinnati | 26-21 | Pontiac |
| 1981 | XV | Oakland | Philadelphia | 27-10 | N Orleans |
| 1980 | XIV | Pittsburgh | LA Rams | 31-19 | Pasadena |
| 1979 | XIII | Pittsburgh | Dallas | 35-31 | Miami |
| 1978 | XII | Dallas | Denver | 27-10 | N Orleans |
| 1977 | XI | Oakland | Minnesota | 32-14 | Pasadena |
| 1976 | X | Pittsburgh | Dallas | 21-17 | Miami |
| 1975 | IX | Pittsburgh | Minnesota | 16-6 | N Orleans |
| 1974 | VIII | Miami | Minnesota | 24-7 | Houston |
| 1973 | VII | Miami | Washington | 14-7 | Los Angeles |
| 1972 | VI | Dallas | Miami | 24-3 | N Orleans |
| 1971 | V | Baltimore | Dallas | 16-13 | Miami |
| 1970 | IV | Kansas City | Minnesota | 23-7 | N Orleans |
| 1969 | III | NY Jets | Baltimore | 16-7 | Miami |
| 1968 | II | Green Bay | Oakland | 33-14 | Miami |
| 1967 | I | Green Bay | Kansas City | 35-10 | Los Angeles |
5. History of football in the US
source: Bill sports maps
6. The Top-Searched Super Bowl Recipes by State
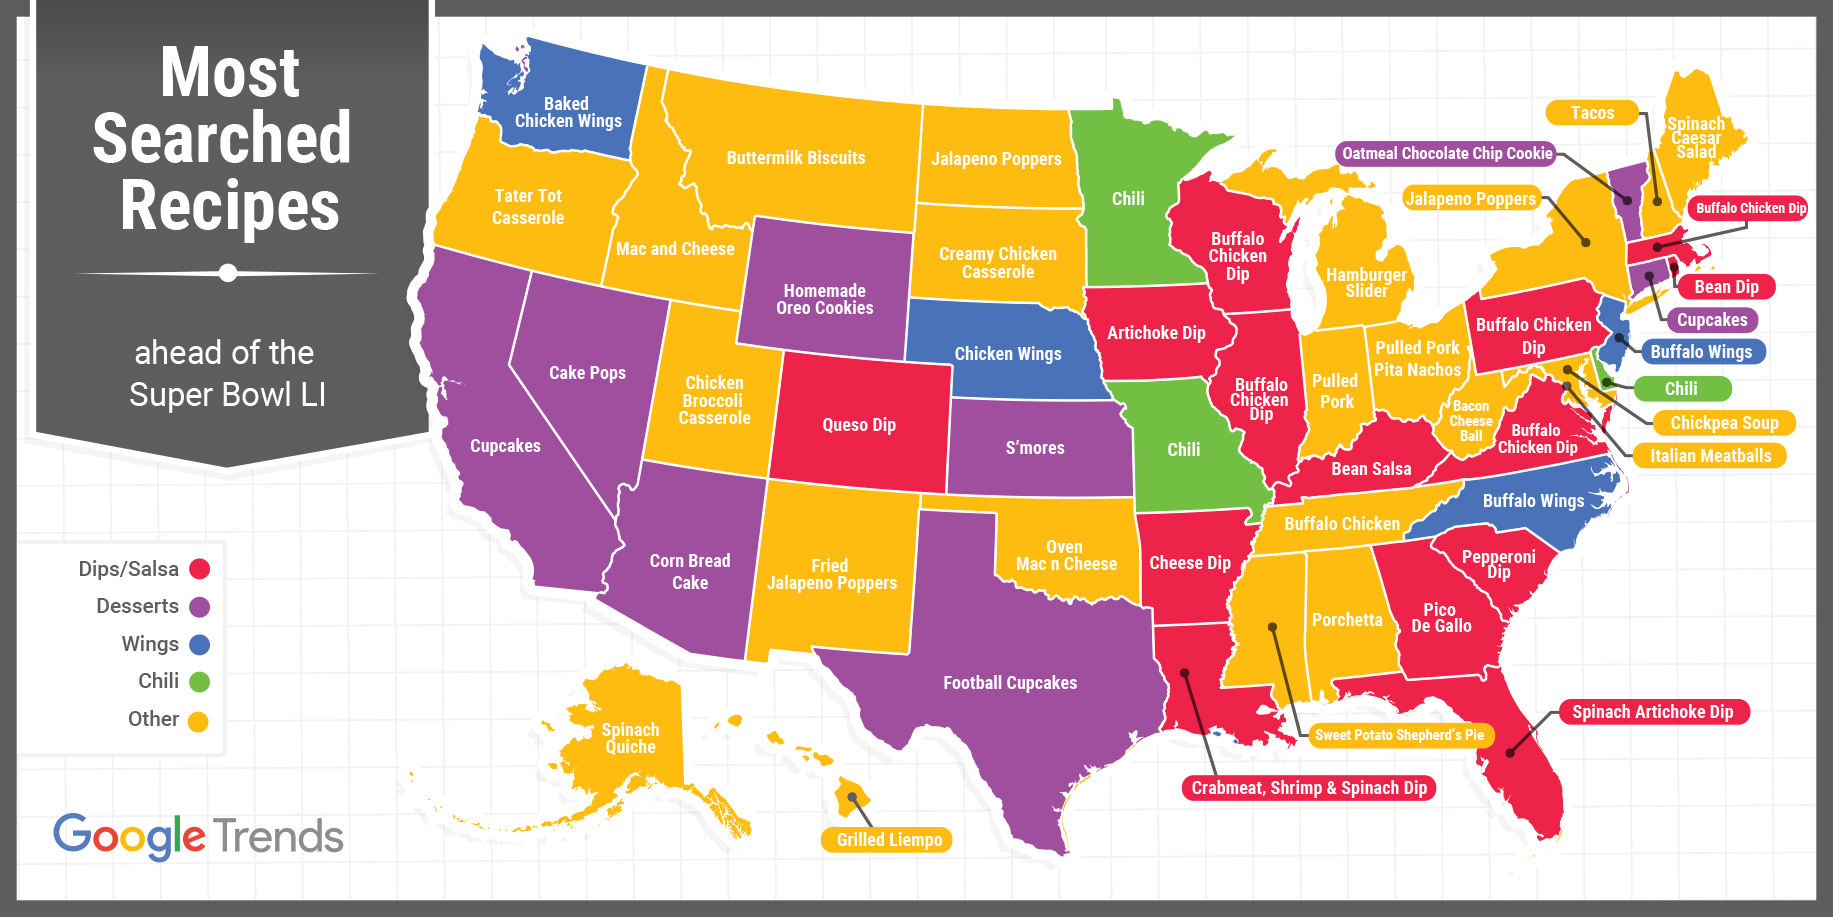
source: Eater
7. Cost of a 30 second Super Bowl ad 1967-2015
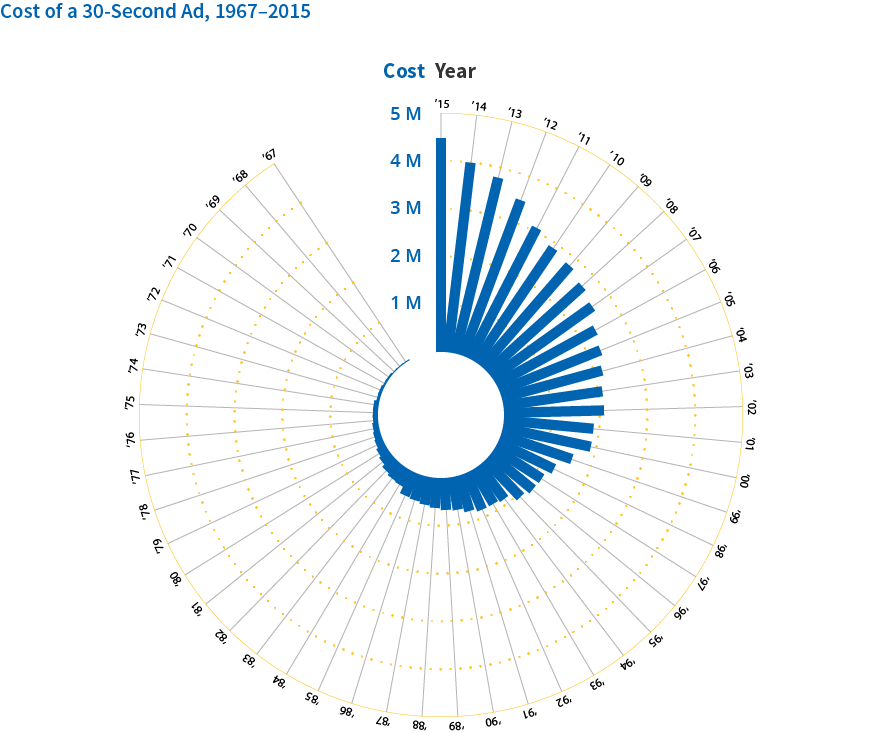
source: USA Today
8. What Types of Superbowl Ads Get Shared the Most?
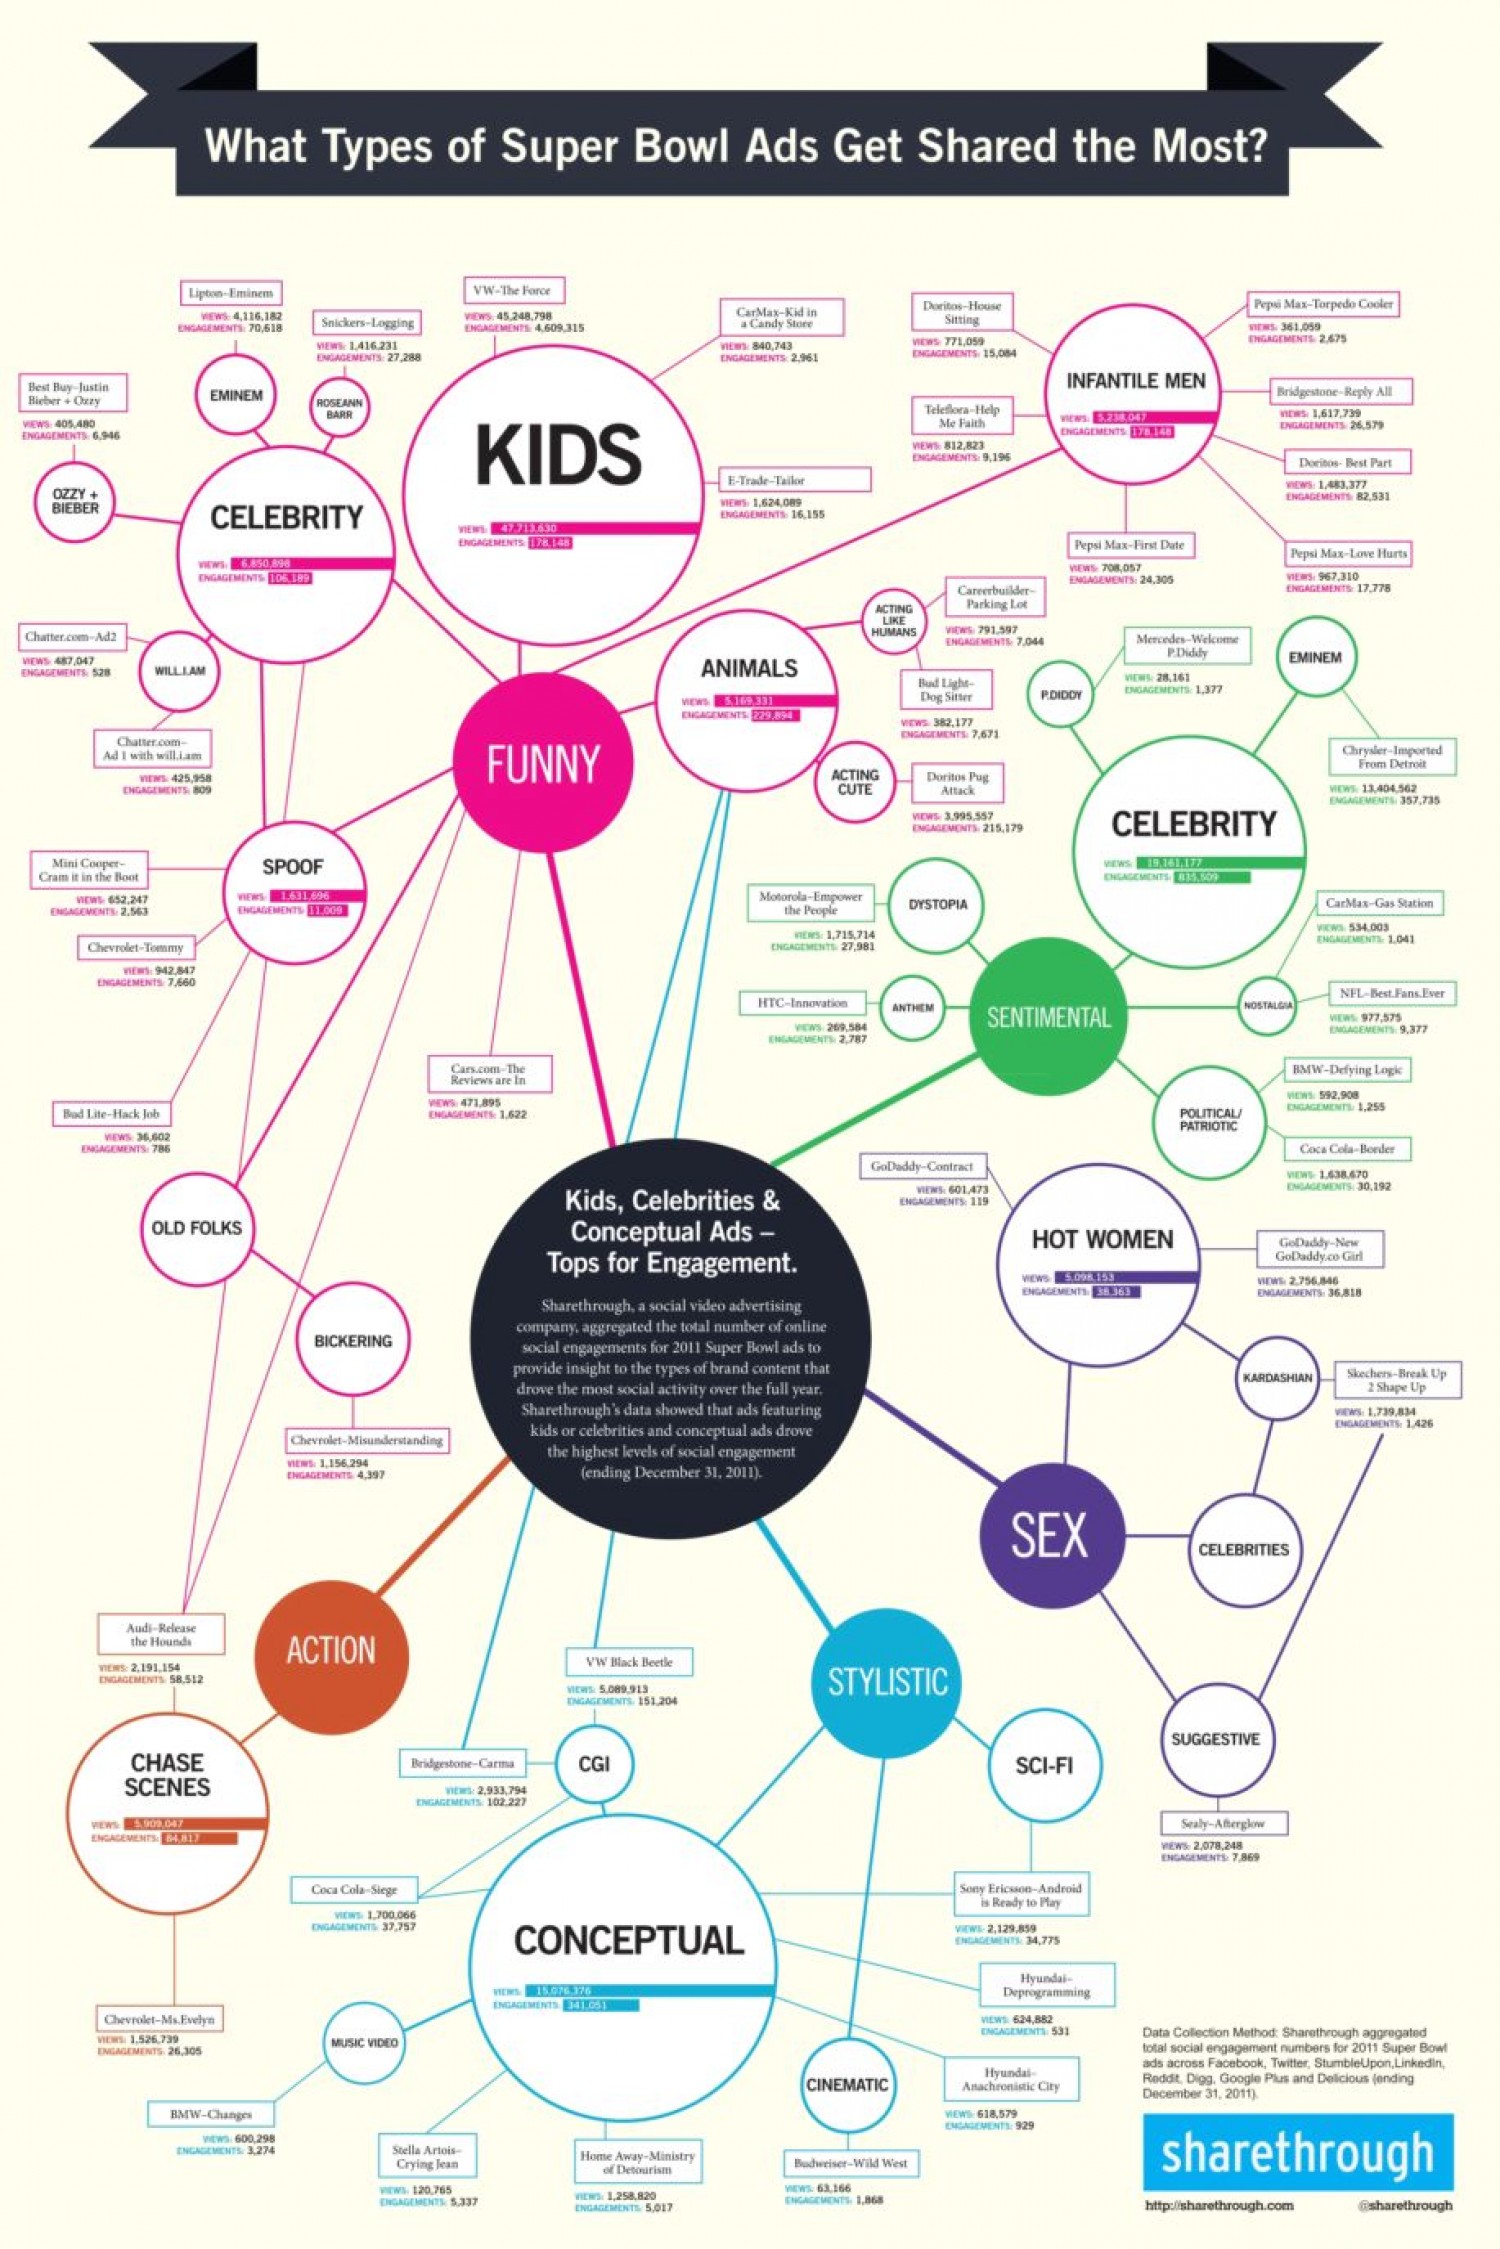
source: Visually
9. How big is Super Bowl
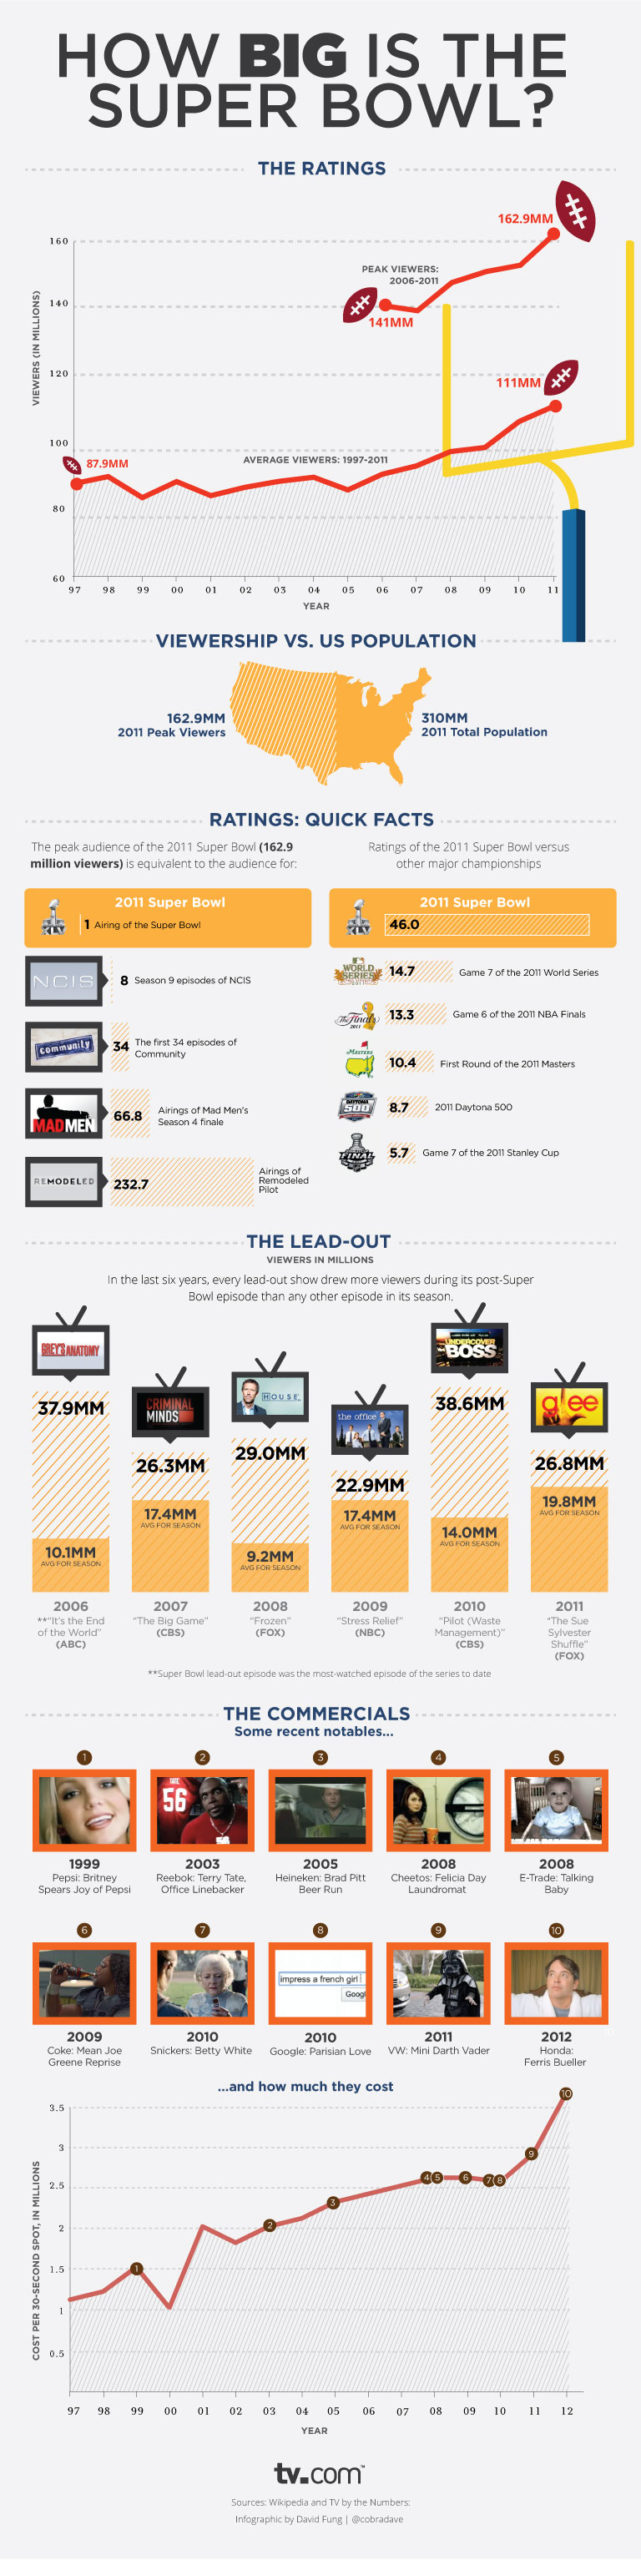
source: TvTome


#Featured

Next article
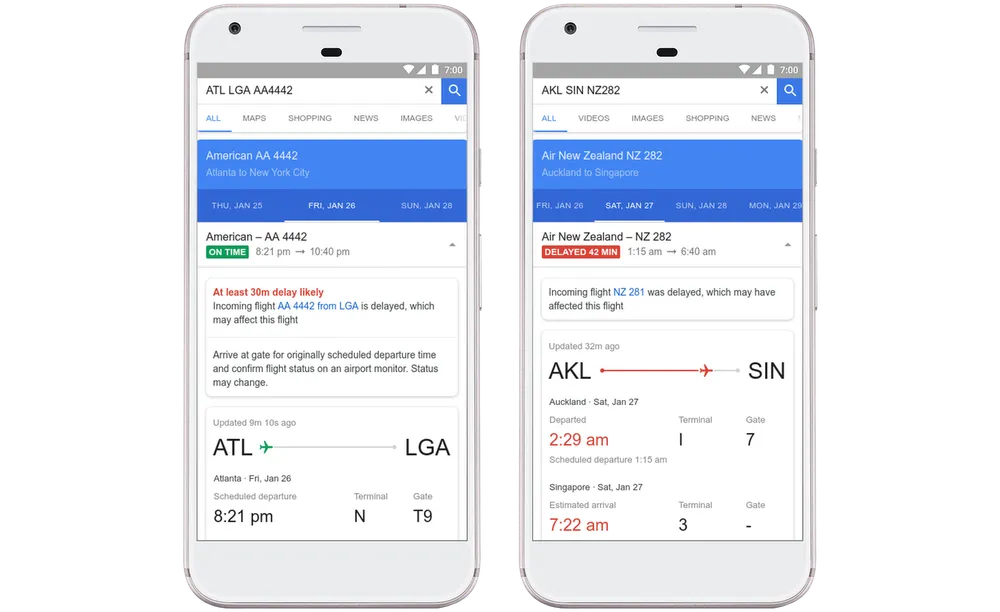

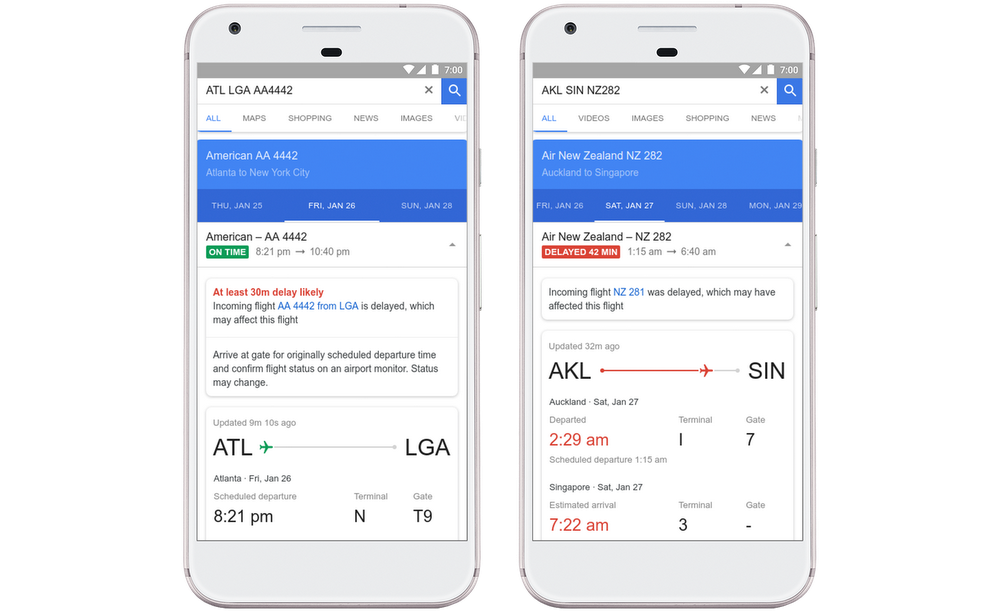 What causes flight delays? The reason could be anything from extreme weather to air traffic congestion to aircraft maintenance issues or something else entirely. The bottom line is, flight delays are extremely frustrating for weary travelers stuck at airports. So, Google is updating its Flights service with an awesome new feature – using machine learning algorithms to predict delays in departure times.
The Flights app is normally populated with the information Google pulls in from the airlines directly. But for this feature, Google has turned to historical flight status data and artificial intelligence technologies to predict when a flight will be delayed.
 The algos will comb the data to see what parameters are common between delayed flights – location, weather conditions, aircraft arriving late from the previous destination, etc. Once Google is at least 80% sure that these factors are conspiring in a manner that an airplane will be delayed, it will flag that information to the Flights app, and also specify the likely reason for the holdup – without waiting for or depending on the information coming in from the airlines.
To be on the safe side, Google still recommends getting to the airport with enough time to spare. But it hopes to give travelers enough information to manage expectations and prevent any unpleasant surprises.
Now, Google is not the first or only one trying to make the travel sector less complex with machine learning. Back in 2013, researchers at Singapore’s Institute for Infocomm Research used machine learning techniques to beat the industry benchmark for the estimation of the arrival time of domestic flights by 40%. Last year, Eastern Macedonia and Thrace Institute of Technology in Greece showcased how it was feasible to predict prices for flights based on historical fare data. But Google’s application of machine learning is certainly taking the technology mainstream like none other.

