NDVI Is Not Enough: What Are Vegetation Indices and How Are They Used in Precision Farming?

For many people working with satellite data, vegetation analysis begins and ends with NDVI. It is the index everyone knows, the default layer in most platforms, and often the first raster students calculate in a remote sensing class.
But precision farming has moved far beyond a single index.
Today, farmers, agronomists, and ag-tech companies operate in a world of multi-sensor constellations, drone-based hyperspectral cameras, and AI-driven analytics. Vegetation indices are no longer just colorful maps. They are decision-support tools influencing irrigation plans, nitrogen application, yield forecasts, and even crop insurance assessments.
So what exactly are vegetation indices, and why does it matter that we look beyond NDVI?
How do vegetation indices work?
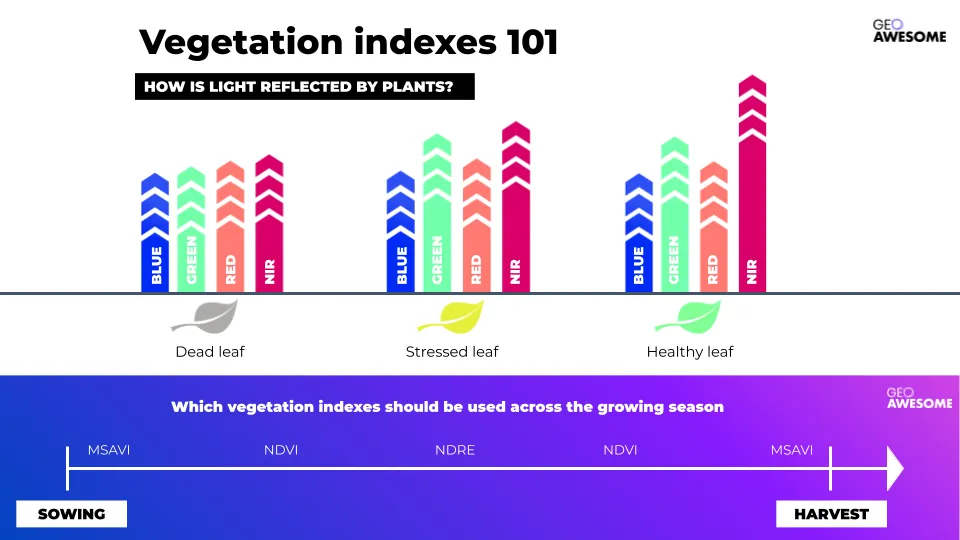
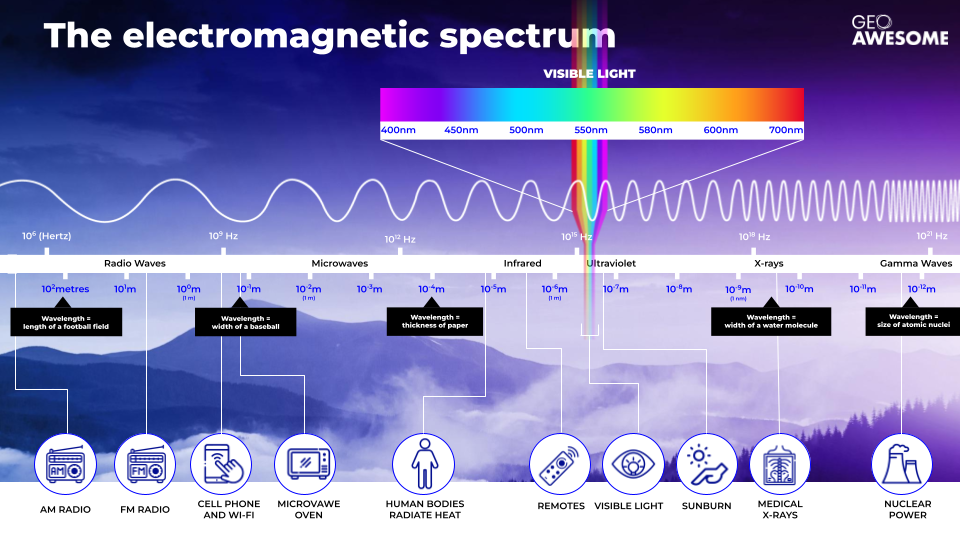
Visible light—the light that reflects off objects and enables us to see them with the human eye—is part of the electromagnetic spectrum; specifically, wavelengths between around 400–700nm. The wavelengths either side of visible light are ultraviolet (UV) and infrared rays.
Plants absorb some of this light, and use it to grow, through the process of photosynthesis. Vegetation indices work by analyzing the light which is not absorbed, but instead reflected off the leaves, using this information to detect plantsand evaluate their condition. Broadly speaking, healthy plants (those rich in chlorophyll) reflect more near-infrared (NIR) and green light than those with stressed or dead leaves.
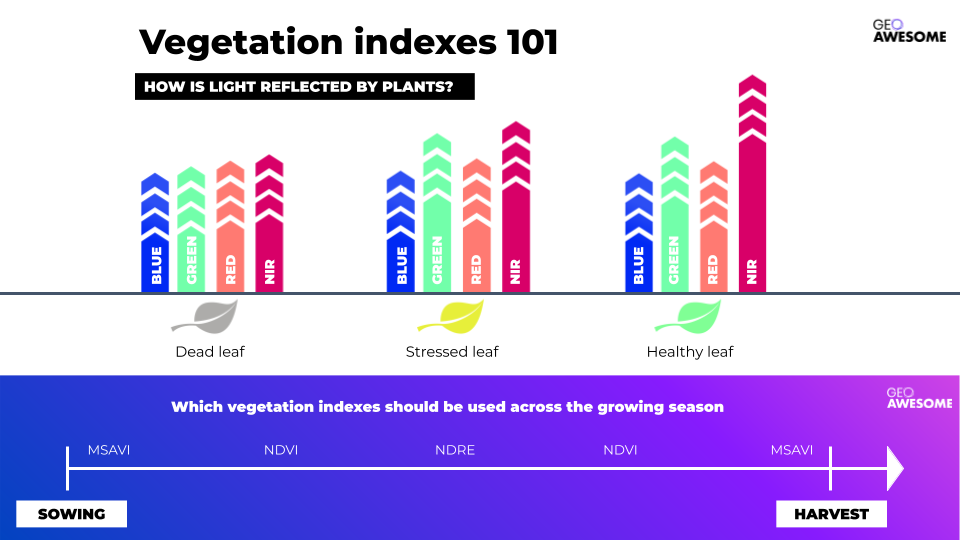
The concept itself is straightforward, and the output from vegetarian indices is relatively easy to interpret: typically, it will be presented in the form of a heatmap, where green color shows healthy vegetation and a red color indicates less healthy plants. This ease of use is one of the reasons that vegetation indices are so widely used in agriculture.
NDVI: A half-century of vegetation analysis
The best-known vegetation index is the Normalized Difference Vegetation Index, or NDVI. Developed in the 1970s, the technology takes advantage of what was at the time a breakthrough in earth observation data: the multispectral data provided by Landsat-1. Despite its 50-year history, NDVI has experienced a boom within the last decade, due to the increased availability of open satellite data—including the Sentinel constellation from 2014 onwards—together with the growing popularity of drone technology, combining to democratize earth observation.
Specifically, NDVI works by comparing red and NIR light to identify the amount of chlorophyll in leaves. Initially it was used simply to detect the presence of vegetation—and NDVI remains one of the most widely used indices for detecting plant canopies using remotely-sensed multispectral data—but the technology was quickly adopted to quantify ‘photosynthetic capacity’, a key indicator of plant health.
The primary disadvantage of NDVI is that the index reaches high ‘saturation’ relatively quickly—effectively, as soon as the field is covered by healthy, reflective leaves, the NDVI will be at a very high level. This naturally makes it a good indicator of plant health and biomass, but it lacks subtlety when it comes to warning signs early in the growing season and vegetation changes late in the season.
Beyond NDVI
Given the limitations of NDVI, and to avoid misinterpretation of results, online farming platforms provide agronomists with a wide range of other vegetation indices to complement NDVI. Some of the most popular ones include:
Modified Soil Adjusted Vegetation Index (MSAVI)
MSAVI is a variation on the Soil Adjusted Vegetation Index (SAVI). Both indexes are designed to mitigate the effects of soil on light analysis, making them more sensitive in circumstances where there is a high percentage of bare soil, scarce vegetation, or low chlorophyll content—all instances where NDVI struggles to provide accurate measurements. MSAVI is therefore most useful for monitoring crops in the first months following sowing.
Normalized Difference Red Edge (NDRE)
Another popular vegetation index, NDRE works by analyzing ‘red edge’ light—the narrow band of the visible light spectrum where red becomes NIR. It’s particularly sensitive to chlorophyll content, changes in leaf area, and the effect of soil in the background. It can measure the NIR light which has penetrated through to the lower part of the canopy, and is therefore ideal for analyzing the health and vigor of mid- and late-season crops, when the leaves have accumulated high levels of chlorophyll. NDRE can also be very helpful for determining the relative nitrogen content of crops, independent of the quantity of nitrogen in the soil.
Canopy Chlorophyll Content Index (CCCI)
CCCI analyzes the relative levels of reflected red, red edge, and NIR light, and is used to estimate the amount of nitrogen—a key component of chlorophyll. By correlating CCCI with tissue samples from crops, farmers are able to accurately estimate the nitrogen (N) variation of across a field. This method can provide information on N levels much earlier in the growing season than other indices, which helps growers to fertilize more precisely and efficiently.
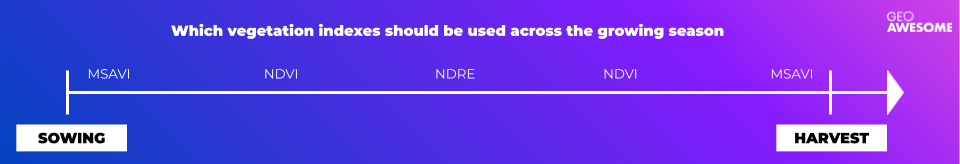
Each vegetation index has a different sensitivity, and therefore they should be applied at different stages in the growth cycle: MSAVI is applied in early stages, when there is limited leaf coverage; NDVI during the period of rapid growth; then NDRE at later stages when leaf coverage is fuller. It can then be useful to return to NDVI and finally MSAVI again as foliage decreases and the crop transitions to ‘senescence’.
How do farmers use vegetation indices in practice?
The tools above are just a small sample of the many vegetation indices which can help farmers understand different parameters of crops or soil, including nitrogen variation, moisture levels, and more. Farmers can access and calculate these indices via farm management platforms, GIS tools, or satellite data and algorithm marketplaces where multiple complex vegetation indices are all available.
However, the increasing popularity of vegetation indices can also lead to a misconception that reflectance values are the definitive measure of vegetation health. This is not the case, and researchers are keen to point out that a vegetation index is a qualitative measurement, rather than a quantitative one. Furthermore, a similar output may mean a completely different thing for two different fields.
Data-driven farms should therefore use multiple indices to analyze the performance of their crops through the season, and integration with other sources of data is key in avoiding misinterpretation. It’s only once these additional data layers are applied that the true meaning of a vegetation index can be understood. An example might be a field in which NDVI indicates underperformance in two separate areas. Without additional data, the assumption may be that the cause of this is the same in both areas. However, other data sources can reveal different issues, including erosion, moisture, or nutrient content.
Fortunately, farmers and agronomists are traditionally hugely risk-averse. They know that one poor decision can have devastating effects on yields. As a result, most agronomists—those who are progressive enough to use vegetation indices at all—will not implicitly trust the data on its own. They will verify the data in person, physically going to the field to inspect the areas, and overlaying the satellite data with other data layers including soil samples and elevation data.
Indeed, knowing how to interpret and apply the data is often more important than the type of camera used to capture it. And of course, vegetation indices do not eliminate the job of the agronomist, as the most important factor in interpreting the data is understanding the physiology of the plant itself. Vegetation indices are useless unless they are used by someone who understands the data, but also the plant, the soil, and the wider environment.
What’s next for vegetation indices?
Researchers, data scientists and agronomists are constantly searching for new formulas that can provide much needed information on crop performance. In some cases, farmers are even looking to create their own custom indices, and some companies already provide index calculators that meet this need. If someone has a thorough understanding of both the physiology of their plants and the data, they can customize an index to answer their specific questions.
There’s also potential to be mined in Synthetic Aperture Radar (SAR). SAR is very well understood by the agriculture industry, and embraced for its ability to penetrate cloud cover, but currently it’s used on a fairly broad level. The fact that it can provide data from below leaf canopies holds great promise for more specific indices.
Finally, the drone industry can offer a different perspective, as the imagery is captured from closer to the ground, with fewer atmospheric factors to contend with. There is therefore less pre-processing and correction needed, and the image resolution is much higher, meaning drone data can potentially be used to more accurately calculate an ‘absolute’ reflectance value from which all the ‘relative’ indices are calculated. Additionally, centimetre level resolution means that it can be observed and calculated with much higher level of detail, even for an individual plant.
Interestingly, very-high resolution satellite data such as Pléiades Neo with 30cm GSD also opens a wide range of possibilities to analyze the conditions of individual plants. Such data are particularly useful for high-value crops like vineyards and olive orchards, which are now facing increasing challenges of drought, so farmers need to use water resources in a far more efficient way.
Combining this ultra-targeted information with more generic overview coming from open satellite imagery may well provide farmers with that perfect combination of data that they seek. Such scenarios are getting more and more feasible with the wide availability of open and commercial satellite data via easy to use marketplaces such as UP42.
Vegetation indices—a vital part of a modern, digitalized farm
There is a whole world of vegetation indices available to the agriculture industry, going way beyond NDVI. In practice, even regular RGB or true color maps will give an agronomist highly relevant information—and very often there is a clear correlation between NDVI and RGB data. Each additional data source can be another powerful instrument in the agronomist’s toolbox, helping them to make informed decisions on the farm.
However, vegetation indices are not absolute values; they are indicators of the health and condition of a plant. To truly understand the information, and to use it for more detailed analysis of crop performance, farmers should combine vegetation indices with other data layers, including elevation models and soil samples. And of course, to make the most effective use of vegetation indices, a farm needs to be operating digitally already—this means using farm management software, variable rate spraying machines, and digitalized processes across the board.


#Science


Next article
For decades, working with geographic data followed a predictable pattern, where analysts opened dashboards, ran queries, and interpreted maps in a reactive process. A human would ask a question, the system would return a result, and the human would decide what to do next. In this model, the system remains idle until a user starts a specific command, and the analyst handles every step of the workflow, including selecting datasets, running spatial operations, exporting results, and interpreting outputs. Even when machine learning models are used, the workflow is still led by the user, who controls the sequence of tasks and connects the data to decisions.
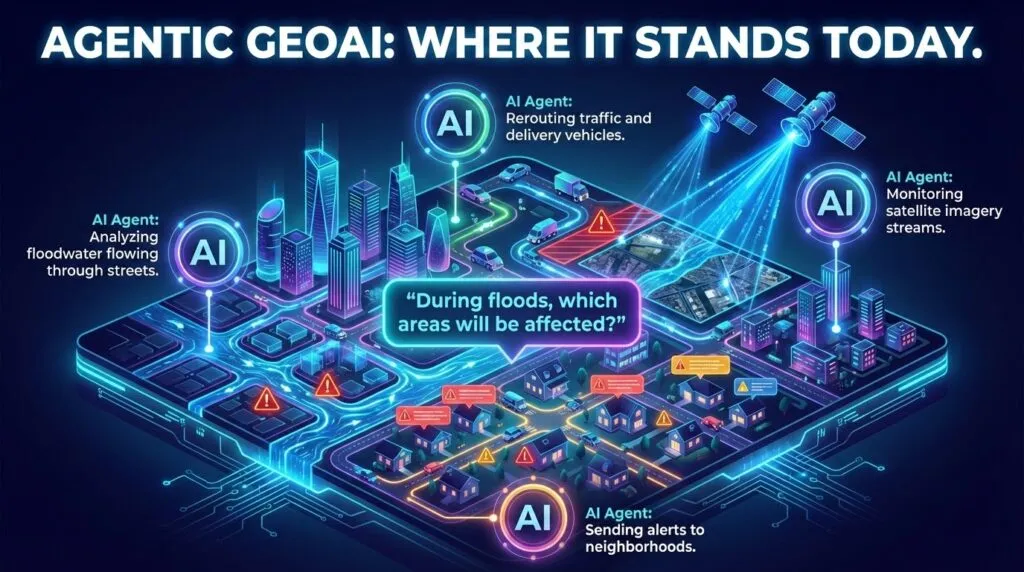
That model is now breaking down. Instead of managing individual steps, users define goals. An AI system receives a mission such as optimizing evacuation routes during a flood or monitoring infrastructure risks across a region. The system then plans the workflow itself, retrieving data, running spatial tools, and producing results autonomously.
Agentic AI is beginning to appear across many industries. Enterprise deployments show how autonomous agents can significantly reduce the time employees spend retrieving and processing information. Similar trends are discussed in research on agentic artificial intelligence and its economic applications, where AI systems manage complex workflows with minimal human supervision.
In geospatial systems, this change carries important implications. Maps are no longer just tools for viewing information. They can become active systems that observe changes, run analyses, and coordinate decisions.
This article explores how agentic systems are redefining GeoAI workflows. It examines the move from dashboards to autonomous spatial agents, the role of geospatial reasoning in enabling agency, and the tools that allow agents to interact with real geospatial infrastructure. It also discusses the rise of multi-agent coordination and why human supervision remains essential as these systems become more autonomous.
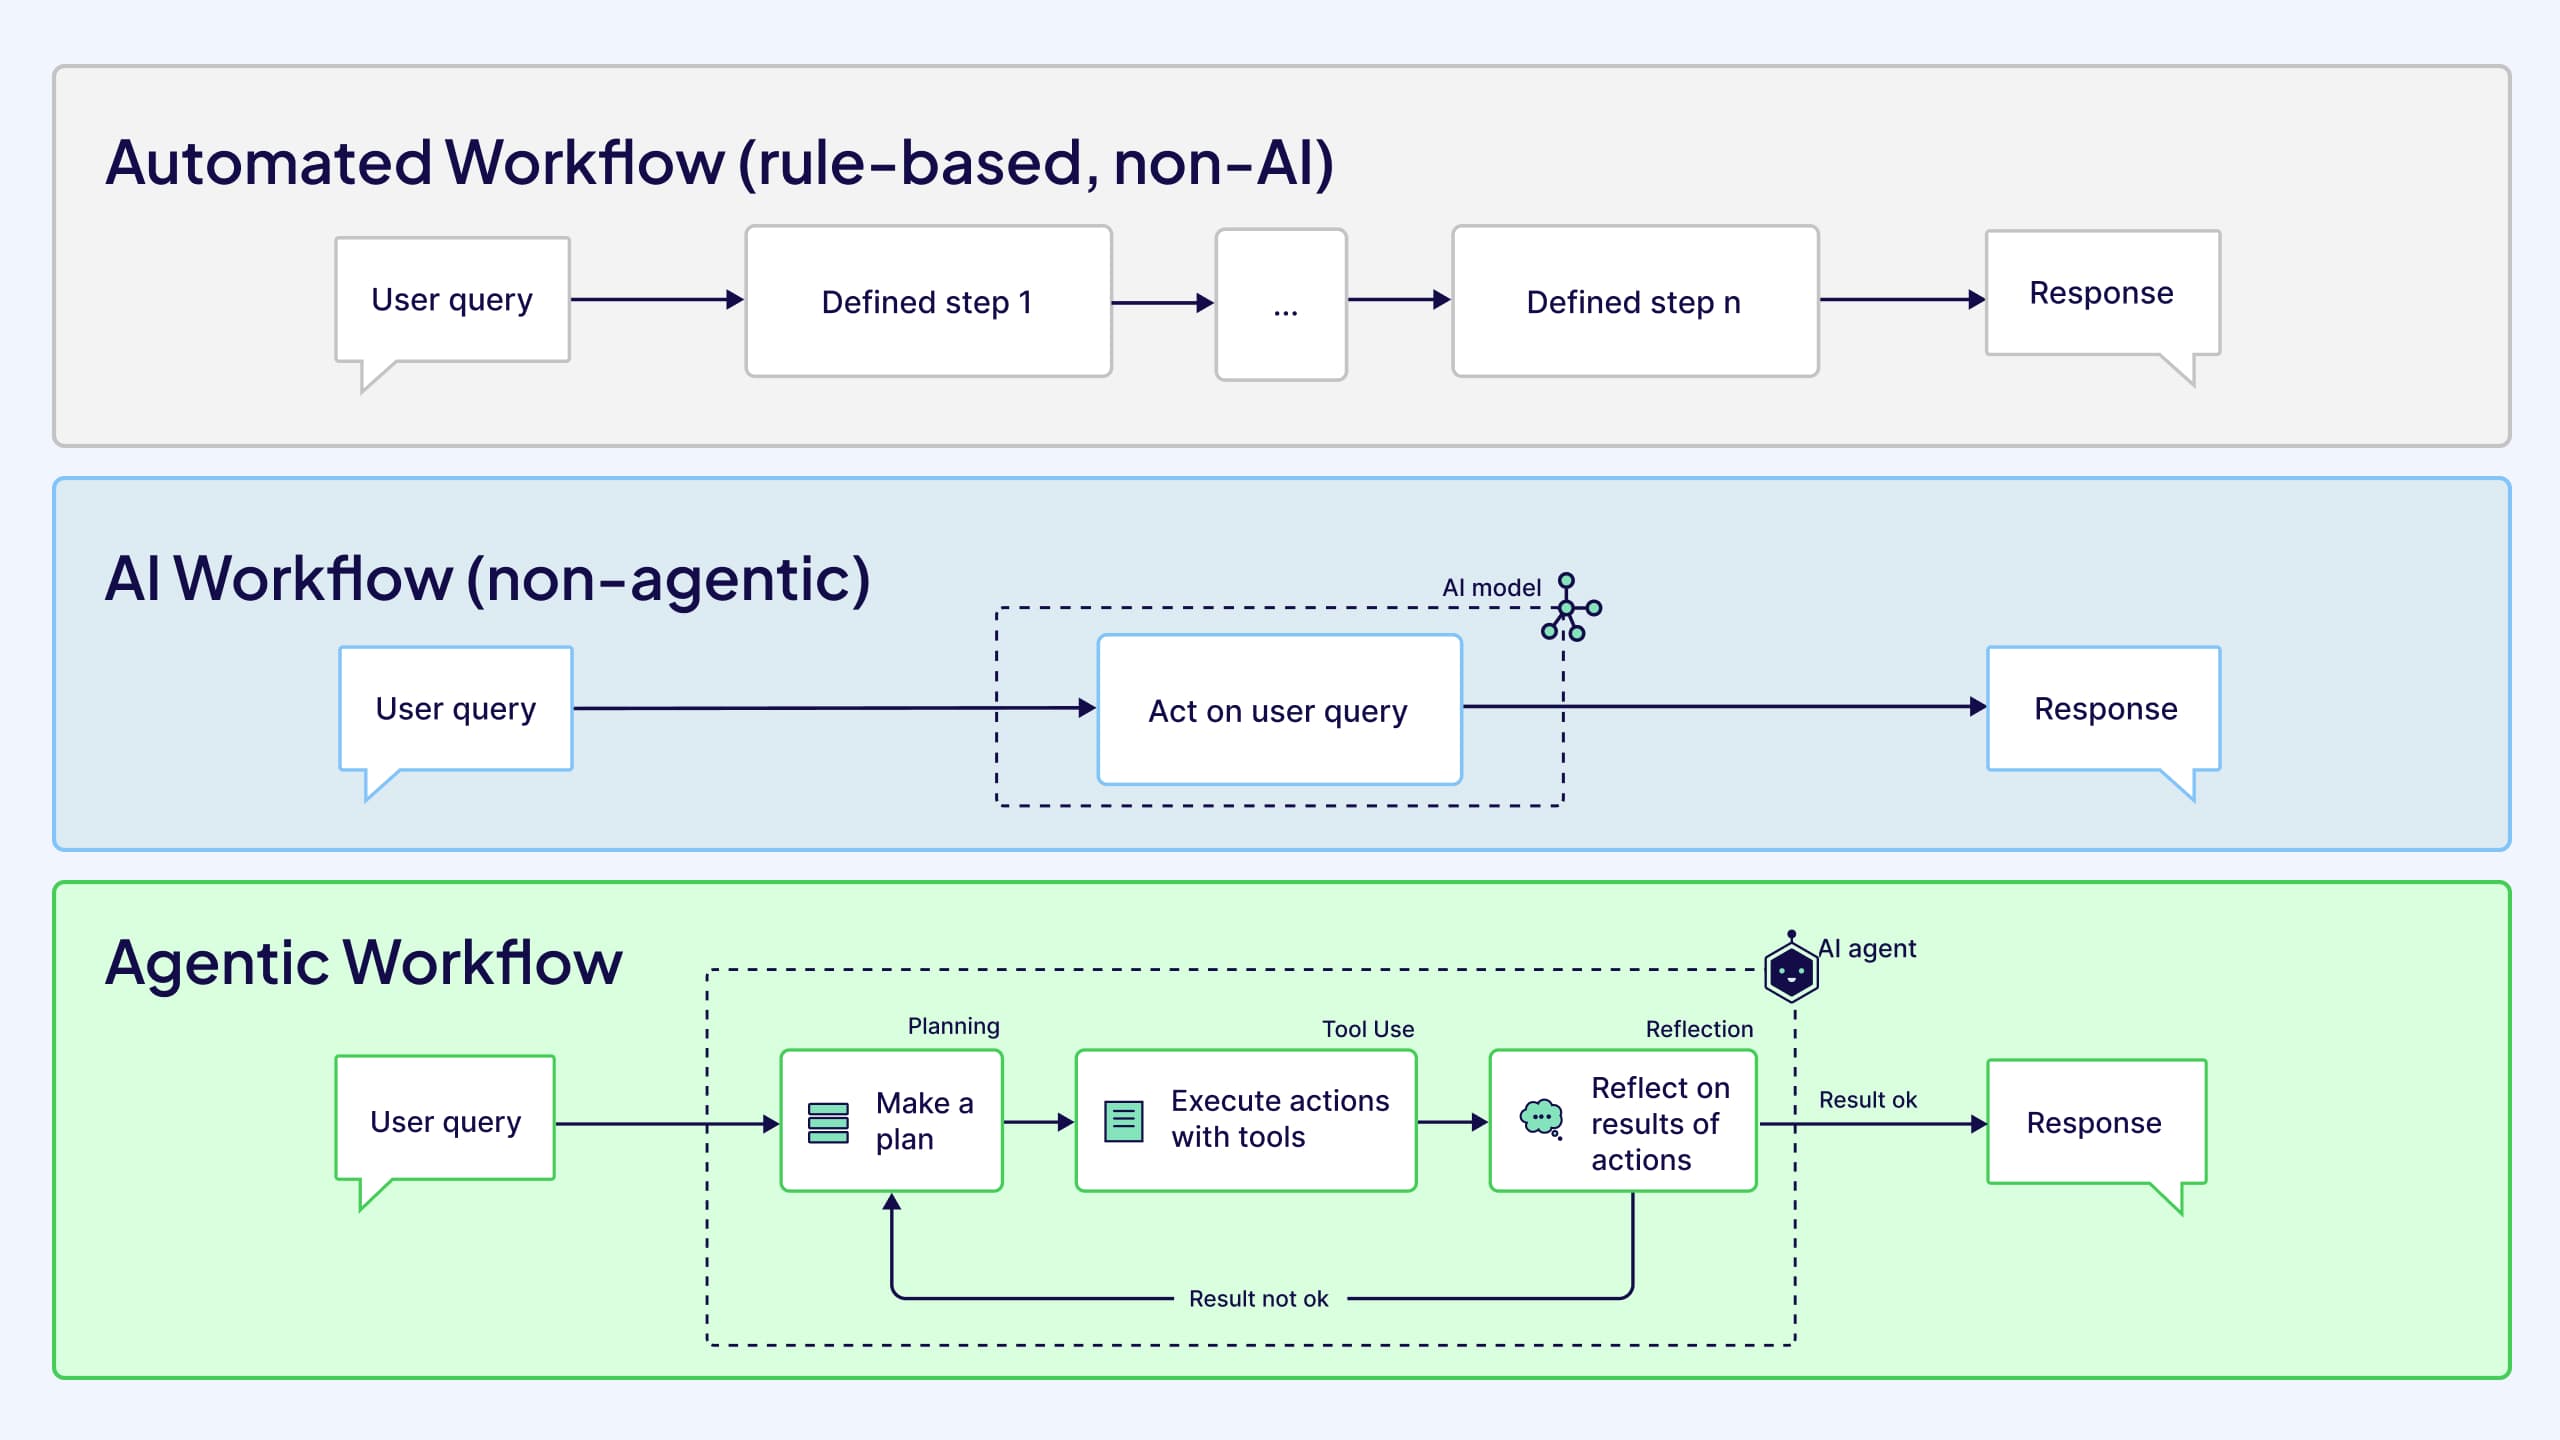
Source: Weaviate
From Dashboard to Autonomy
Traditional GIS workflows are built around step-by-step interaction. Analysts retrieve datasets, run spatial tools, and interpret results manually. Even advanced GeoAI models usually operate within this structure. The system produces outputs, but humans still manage the process.
Agentic systems change this relationship. Instead of controlling each step, users describe the goal, and the system organizes the workflow needed to achieve it.
For example, consider a flood response scenario. A traditional workflow might require analysts to download rainfall forecasts, update hydrological models, request satellite imagery, and manually produce evacuation maps. The agentic system can automate these steps. It monitors incoming data streams, retrieves updated imagery, runs simulations, and produces route recommendations automatically.
This type of autonomous workflow is becoming more feasible as AI systems learn to plan tasks and coordinate multiple tools. Technical discussions of autonomous AI systems and agentic architectures describe how complex goals can be decomposed into smaller actions that agents execute sequentially.
Geospatial agencies are beginning to explore these capabilities as well. The GeoAI in Focus report from the Pennsylvania GeoBoard highlights how automated spatial systems can support infrastructure monitoring, disaster management, and environmental analysis.
From Reasoning to Agency
Autonomous geospatial systems require more than pattern recognition. They must understand how spatial systems behave.
This capability is often described as geospatial reasoning. It allows AI systems to interpret relationships between geographic features and to respect physical constraints. Roads connect networks, water flows downhill, and infrastructure interacts with terrain. Without this understanding, automated systems may generate results that are mathematically correct but physically impossible.
The agency builds on this reasoning ability. If reasoning is the system’s understanding of spatial relationships, the agency is its ability to act on that understanding.
Models for grounded spatial reasoning (like Spatial-Agent) show how AI systems can incorporate geographic rules directly into their decision processes. Instead of simply predicting patterns, these systems evaluate whether spatial outcomes are physically plausible.
Three-dimensional spatial data can also improve this reasoning ability. The LOD1 3D city models and urban spatial intelligence provide much richer information for navigation, infrastructure planning, and environmental modeling than traditional two-dimensional maps.
Large research organizations are also exploring how AI agents can simulate possible future scenarios. Microsoft’s research agenda on trusted agents and simulation-based reasoning describes systems that evaluate how cities and infrastructure may change over time rather than simply analyzing current data.
Together, these developments move GeoAI from a system that analyzes spatial patterns to one that can plan actions within spatial environments.
The Tool-Use Revolution in GIS
For geospatial agents to act autonomously, they must be able to use the same tools that human analysts rely on. In traditional GIS environments, spatial analysis depends on manual interaction with software: running buffers, querying datasets, requesting satellite imagery, or executing Python scripts. Each step requires a person to trigger the next operation.
Agentic systems treat these tools differently. Instead of waiting for human input, the system identifies which tool is needed and executes it automatically. In effect, geospatial APIs and software libraries become the “hands” of the agent, allowing it to interact with spatial data and infrastructure directly.
Consider a scenario where a monitoring system detects unusual activity in satellite imagery. A traditional workflow would require an analyst to inspect the image and manually request higher-resolution data. An agentic system could recognize the uncertainty itself and automatically order a higher-resolution image from a satellite provider. The system is no longer just interpreting data. It is actively collecting the information it needs.
This capability is becoming possible as geospatial tools are redesigned for machine interaction. Frameworks such as GIS-MCP, which allow AI systems to interact with geospatial Python libraries, enable agents to execute operations in GeoPandas or Shapely through natural language commands rather than manual scripting.
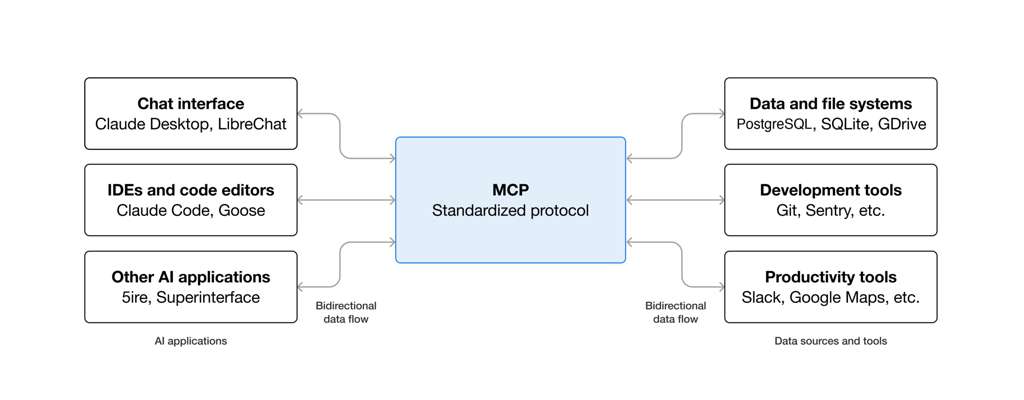
Source: Skywork.ai
Satellite infrastructure is evolving in the same direction. Platforms like Vantor’s unified satellite tasking API allow a single system to communicate with multiple satellite constellations without needing separate integrations for each provider. This simplifies the process of retrieving imagery when agents need updated observations.
On-demand satellite intelligence platform services push this idea further by enabling automated satellite tasking directly through AI systems. These capabilities are already attracting attention in defense and security environments. Together, these developments transform GIS software from a static toolkit into an interactive environment that autonomous agents can operate within.
Multi-Agent Spatial Orchestration
Many geospatial problems involve complex interactions between environmental, infrastructural, and social systems. Flood prediction, urban resilience planning, and climate adaptation all require multiple models and data sources working together. A single AI system often cannot manage this complexity alone.
This is where multi-agent systems become important. Instead of one general model performing every task, multiple specialized agents collaborate to solve different parts of the problem. They are often defined as collections of autonomous entities that make independent decisions while coordinating toward shared goals, as seen in domains such as autonomous vehicle coordination and smart grid management.
Current geospatial systems are not yet fully multi-agent. They typically operate as centralized workflows composed of analytical components rather than independent, decision-making agents. However, they still highlight the need for coordination across models, data sources, and tasks that multi-agent approaches are designed to address.
For these agents to collaborate effectively, they need a shared representation of the environment. Spatial knowledge graphs provide one such structure. In these graphs, geographic features such as roads, bridges, buildings, and weather systems are connected through relationships that allow agents to reason about dependencies and impacts.
Context-aware retrieval systems built on spatial knowledge graphs combine geographic data with textual information, enabling agents to interpret both maps and documents when solving operational problems. Microsoft Research’s work on agentic AI collaboration systems examines how teams of specialized agents can coordinate tasks and share information when solving complex research problems. Multi-agent architectures are also appearing in engineering environments, where coordinated agents have been shown to significantly accelerate complex design workflows.
In geospatial contexts, these collaborative systems could allow AI to monitor and manage multiple spatial processes simultaneously. Instead of isolated analyses, the future of GeoAI may involve networks of specialized agents coordinating decisions across entire cities or ecosystems.
The Human-in-the-Loop Problem
As geospatial agents become more autonomous, the role of GIS professionals changes. Instead of manually processing data, analysts increasingly act as supervisors of automated systems.
This oversight matters because agentic systems can still make serious spatial errors. One example is geo-hallucination in urban analytics, where AI systems infer roads, bridges, or paths that do not actually exist. To reduce these risks, governance frameworks are becoming essential. The Dual-Helix governance framework for reliable agentic AI in WebGIS development separates the responsibilities of human rule-setters and AI executors so that autonomy does not become uncontrolled action.
Major GIS platforms are already moving in this direction. New AI assistants in ArcGIS environments introduced in February 2026 include role-based permissions that define what automated systems are allowed to do. Even consumer platforms such as Google Earth’s 2026 roadmap and natural-language search updates still emphasize the need for human validation.
Autonomy changes the role of geospatial experts, but it does not remove them. It makes their judgment more important.
The next stage of GeoAI may transform maps into living systems. Instead of static visualizations, geospatial platforms could function as continuously operating infrastructures that monitor environmental signals, infrastructure conditions, and human activity in real time.
Early signs of this shift already appear in connected work graphs and real-time risk intelligence, where dynamic information networks act as operational command centers. Similar ideas appear in discussions of advancing AI maturity and governance orchestration, where organizations coordinate complex systems through AI-driven decision platforms. Experimental environments for AI-driven discovery and decision intelligence suggest that geospatial intelligence may eventually operate as a continuous background layer supporting planning and monitoring across cities and ecosystems.
If that happens, maps will no longer be something we consult occasionally. They will become active systems that monitor change, anticipate risk, and assist decisions continuously.
GeoAI began as a tool for understanding geographic patterns. With the rise of agentic systems, it may evolve into something far more powerful: a dynamic network of intelligent systems helping manage the planet itself.
Further Resources:
- https://opengeoai.org/examples/AI_agents/
- https://github.com/opengeos/gee-agents
- https://mapsplatform.google.com/ai/
- https://www.youtube.com/watch?v=gwxNOYHOt1E
- https://www.nv5.com/geospatial/solutions/geoai/
- https://www.forbes.com/councils/forbesbusinesscouncil/2025/07/15/geoagentic-ai-unlocking-actionable-geospatial-intelligence/
Did you like this post? Read more and subscribe to our monthly newsletter!

