In order to optimize anything such as money, time, efforts and resources, one should understand the ground realities and behavioral pattern on how things are changing over time. But, in case of location based business, it has to deal with additional dimension, obviously it is ‘LOCATION’.
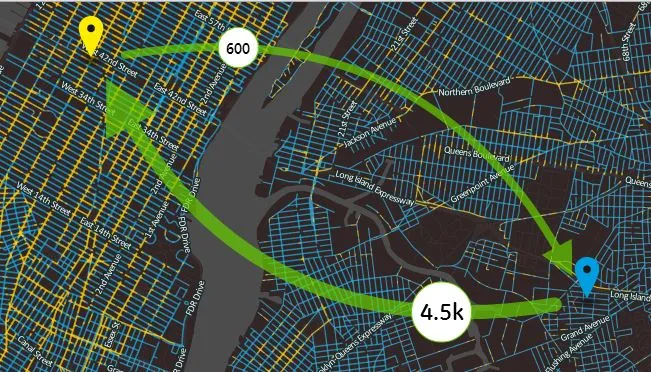
Here, I am talking about an interactive map (HubCab tool) which presents behavioral patterns of over 150 million taxi journeys in New York city and put them on online map canvas which was built by Audi and MIT researchers.
It is aimed to help people and researchers to track down where, how, and at what times different parts of cities become stitched together as hubs of mobility and understand its economic and environmental impact. The online project is expect to lead to new insights into how car sharing schemes could work.

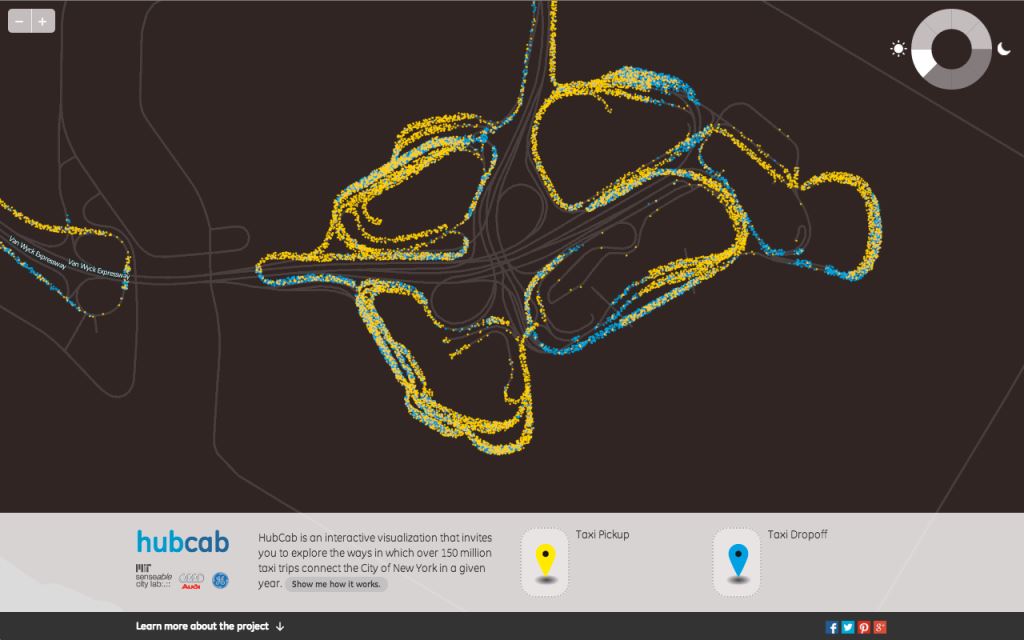
Screenshot of HubCab, showing all taxi pickups and drop offs at JFK airport daily between 3AM and 6AM.
Main underlying data for this HubCad tool is a data set of over 170 million taxi trips of all 13,500 Medallion taxis in New York City in 2011 and then mapped using open source maps of New York City to create the interactive maps. (Source)
With this information, researchers can identify commuter travel patterns and work to develop a more efficient car share system.
The MIT researchers say that HubCab technology could not only save people money and time, but also make it easier to plan travel around the city. They also say a ride sharing scheme could cut the number of taxi journeys by 40%.
MIT and Audi are interested in solving future mobility challenges, such as the increasing mobility demands that are placed against limited infrastructure capacity.
A simply awesome research and project !!! What’s on your mind?


