Interactive map of global corruption
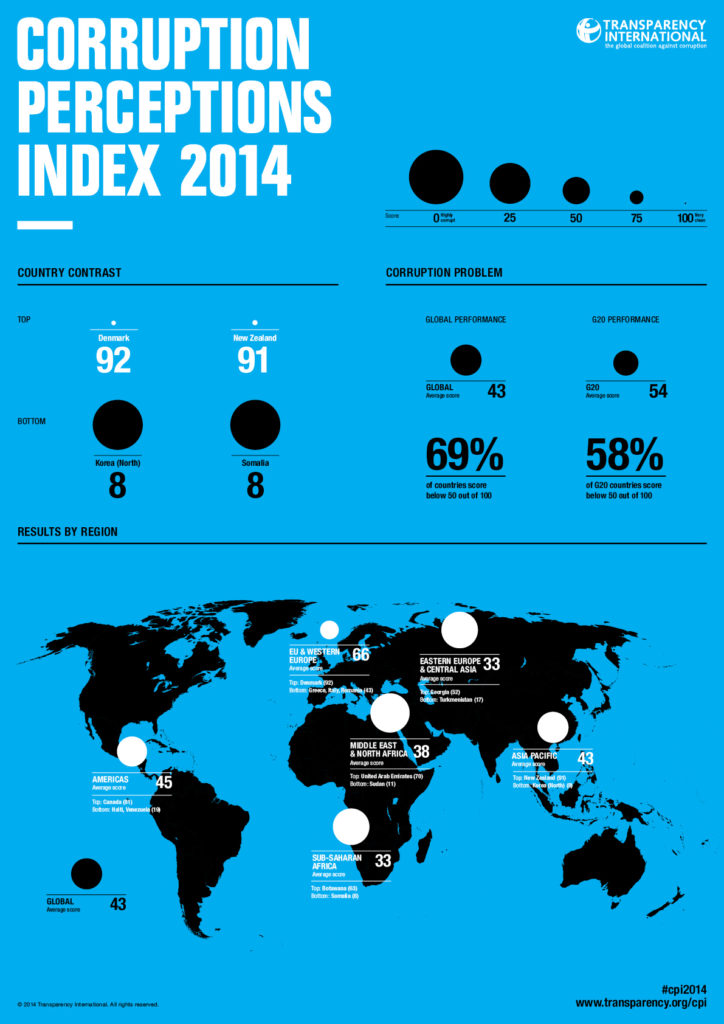
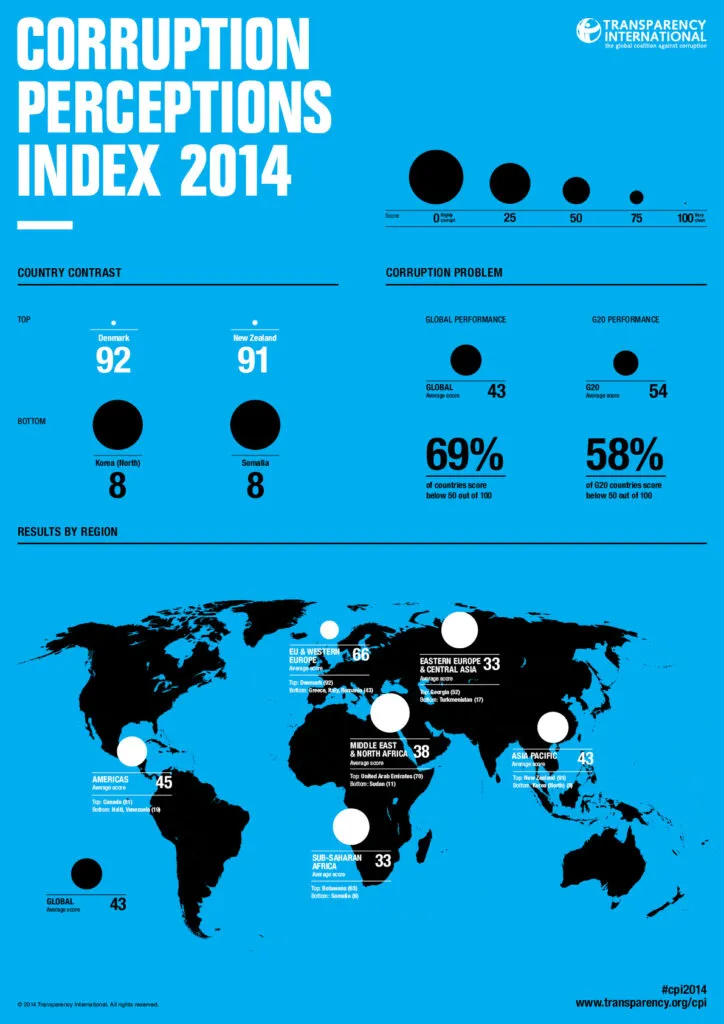
Transparency International published their annual report on global corruption. The Corruption Perceptions Index ranks all countries by their perceived levels of corruption, as determined by expert assessments and opinion surveys. The top score a country can get is 100. The best rated country is Denmark with a score of 92, followed by New Zealand on 91 and Finland on 89. At the other end of the scale, Somalia and North Korea shared joint last place with a score of just 8 points.
From our perspective the most interesting feature of the project is of course the interactive map. The solution is based on Mapbox API and it’s quite cool. The choropleth map shows the actual value of the Index in each country. You can zoom in and out as well as point on a particular country to get more details. Simple but very practical.
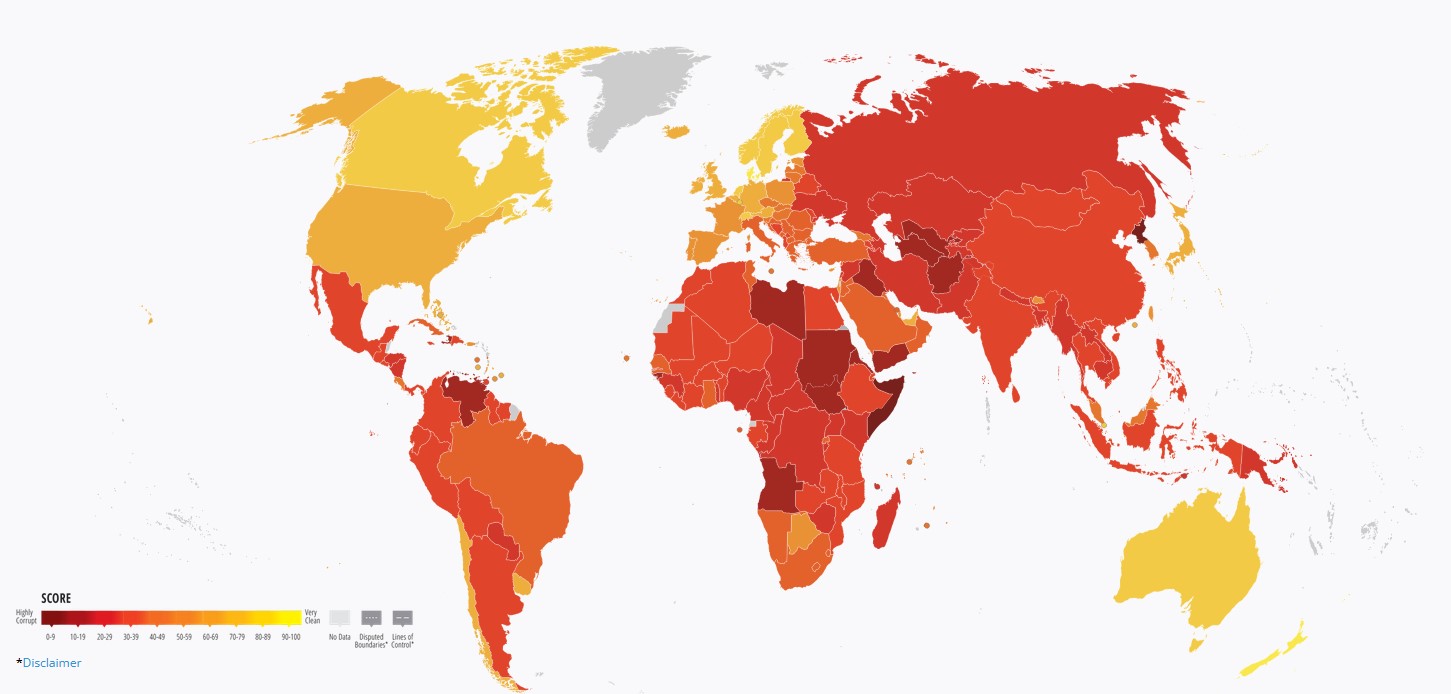
Source: transparency.org
The results of the report are also presented on that cool infographic:
source: Transparency International


