24 maps and charts that explain 9/11 and its long-term consequences
On September 11, 2001 a series of airline hijackings and suicide attacks by 19 terrorists associated with the Islamic extremist group al-Qaeda shocked America and the entire world. Some 2,750 people were killed in New York, 184 at the Pentagon, and 40 in Pennsylvania where one of the hijacked planes crashed after the passengers attempted to retake the plane.
Today marks the 20th anniversary of this tragic day and 20 years of war against terrorism. This collection of maps, charts, graphics and videos aims to explain some of the important facts behind the 9/11 events and resulting consequences around the world.
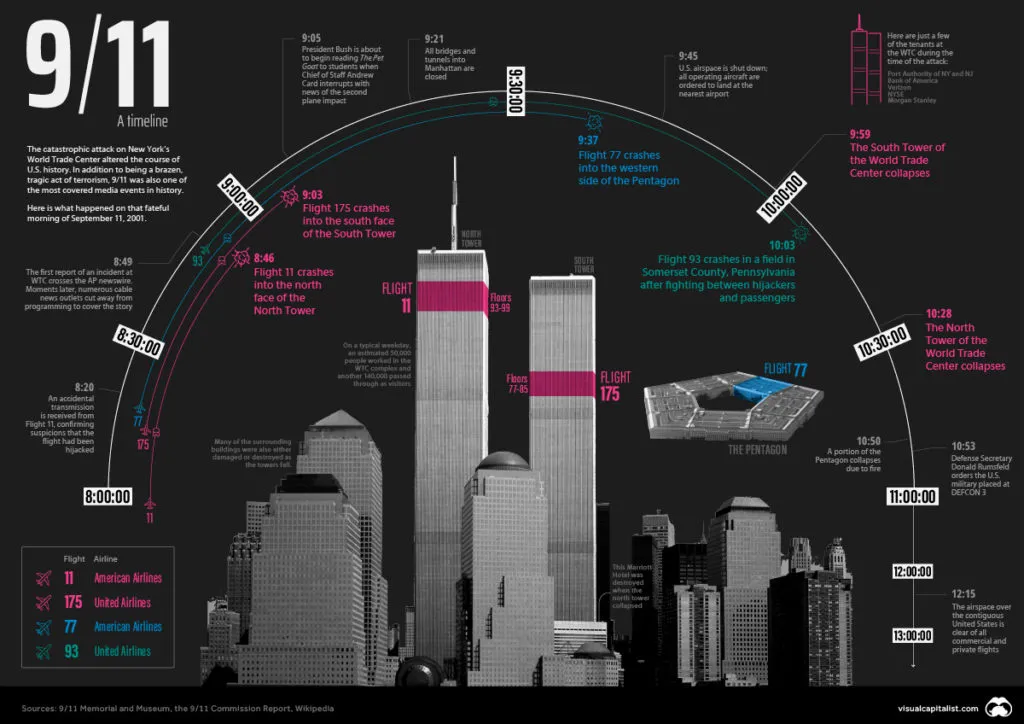
1. A timeline of the terrorist attacks on September 11, 2001
At 8:46 a.m. ET, American Airlines Flight 11 (traveling from Boston to Los Angeles) hit the north tower of the World Trade Center in New York City. At 9:03 a.m. ET, United Airlines Flight 175 (traveling from Boston to Los Angeles) hit the south tower of the World Trade Center in New York City. At 9:37 a.m. ET, American Airlines Flight 77 (traveling from Dulles, Virginia, to Los Angeles) hit the Pentagon Building in Washington. And at 10:03 a.m. ET, United Airlines Flight 93 (traveling from Newark, New Jersey, to San Francisco) crashed in a field near Shanksville, Pennsylvania.
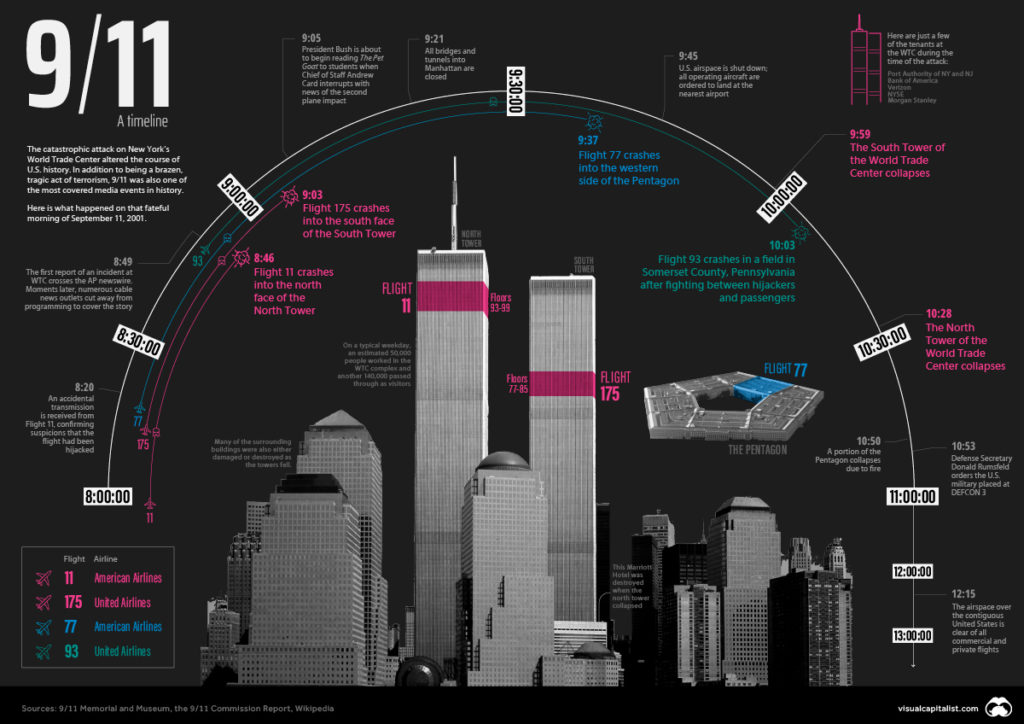
Image credit: Visual Capitalist
2. A map of the terrorist attacks on September 11, 2001
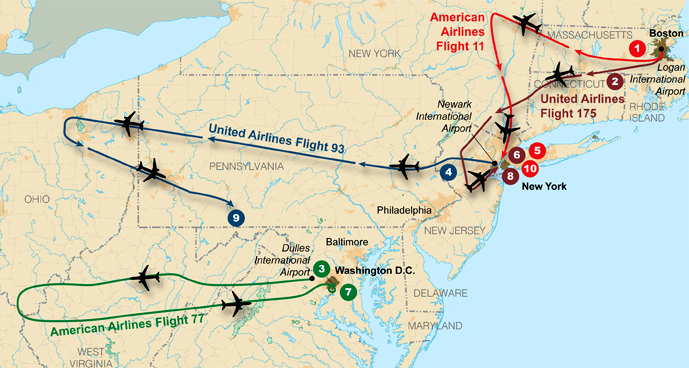
Image credit: FBA
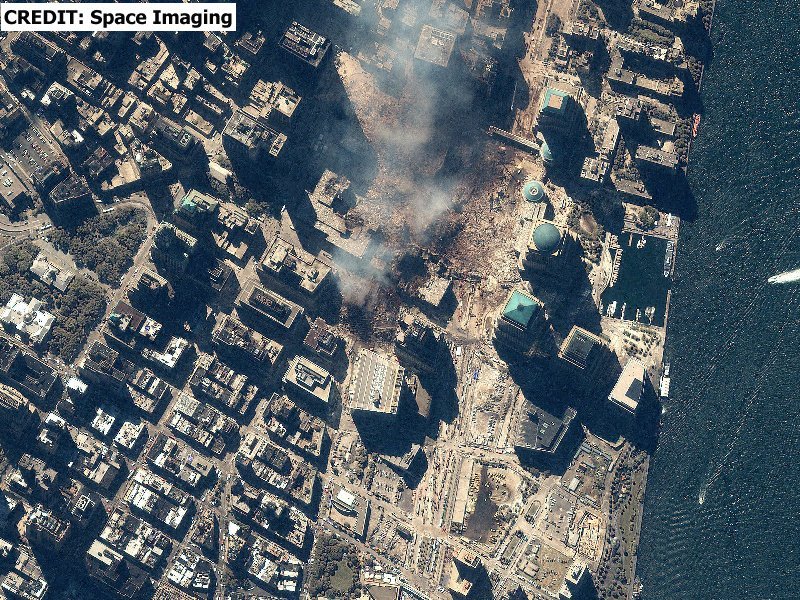
3. Satellite image of Ground Zero in NY on September 15, 2001
This one-meter resolution satellite image of Manhattan, New York was collected at 11:54 a.m. EDT on Sept. 15, 2001 by Space Imaging’s IKONOS satellite. The image shows the remains of the 1,350-foot towers of the World Trade Center, and the debris and dust that has settled throughout the area. Also visible are the many emergency and rescue vehicles in the streets in the vicinity of the disaster.
source: Global Security
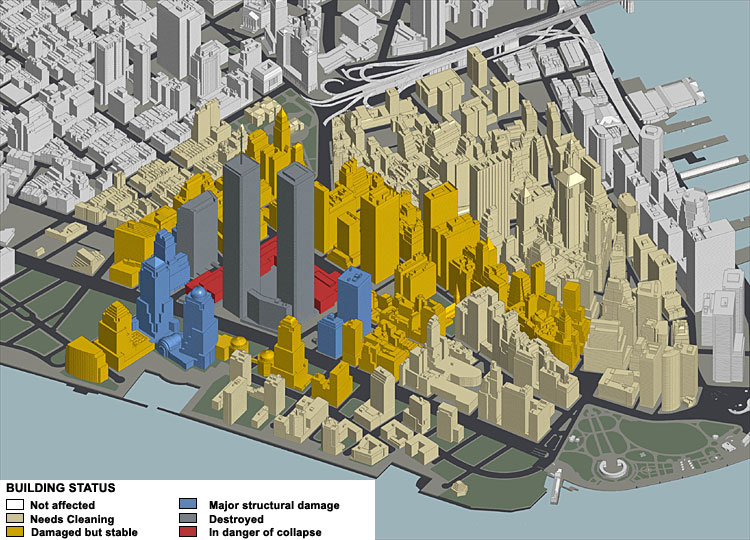
4. Lower Manhattan Building Status
source: CNN
5. Fatalities of 9/11
The 9/11 death count reached 2,977 victims, the majority of which were civilians. This chart goes more in-depth on the people that died in the Twin Towers plane crash, at the Pentagon, and in Shanksville.

source: PW
6. Countries That Lost Citizens in 9/11
While the attacks were aimed at the United States, 372 foreign nationals from 61 countries were also victims.
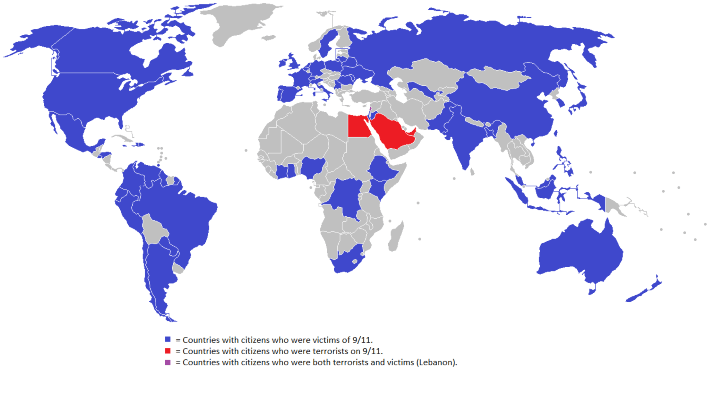
Image source: Reddit user thepenaltytick
7. Road to 9/11
8. In October 2001 American and British forces jointly launched attacks on Taliban-controlled Afghanistan
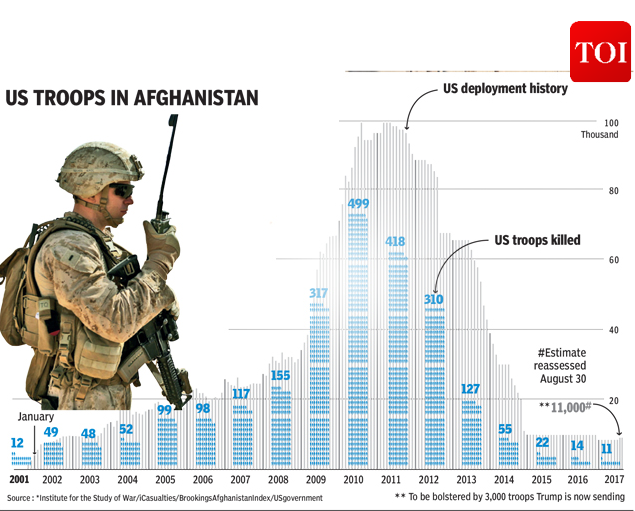 source: Times of India
9. Key milestones of the US intervention in Afghanistan
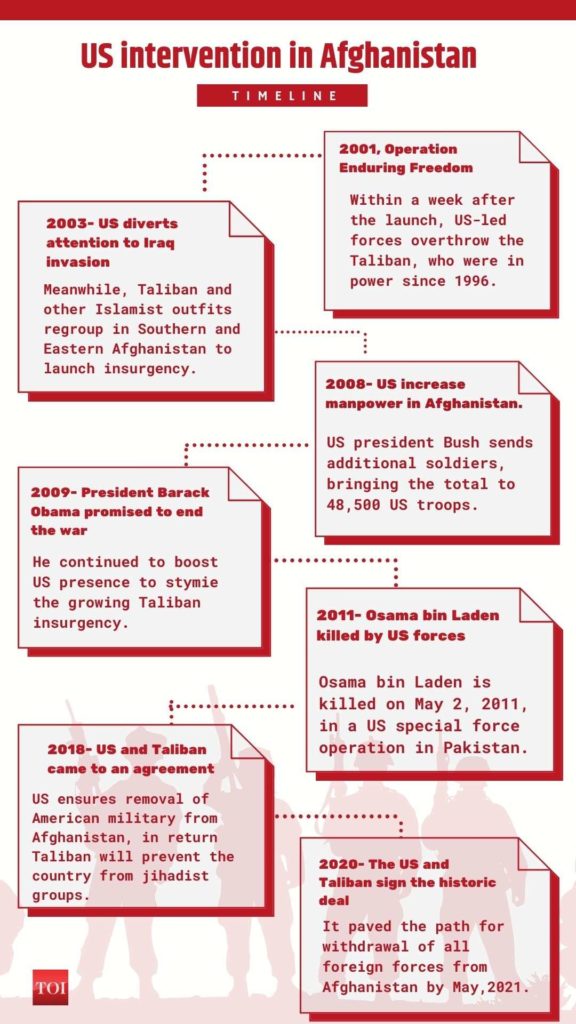
source: Times of India
10. In U.S. invaded Iraq to topple the Saddam Hussein regime on claims of links to al-Qaeda terrorist group and possession of weapons of mass destruction
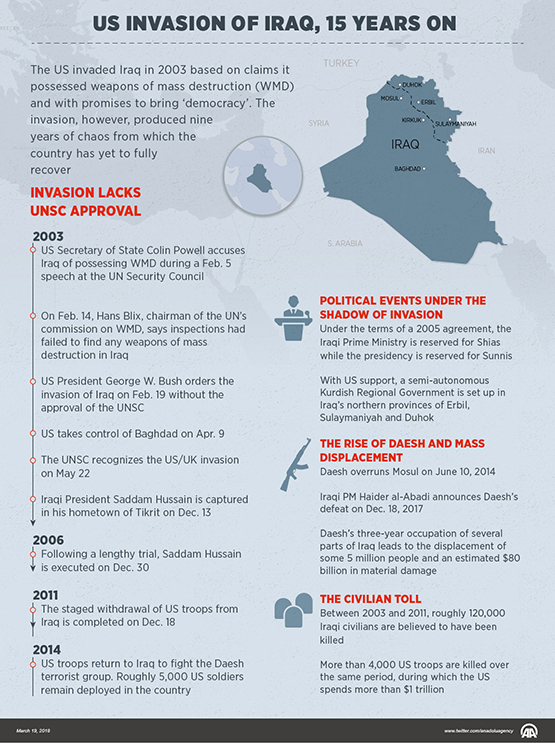
source: AA
11. The total number of at least 113,493 civilian people were killed in Iraq as a result of the military operations between 2003 and 2011
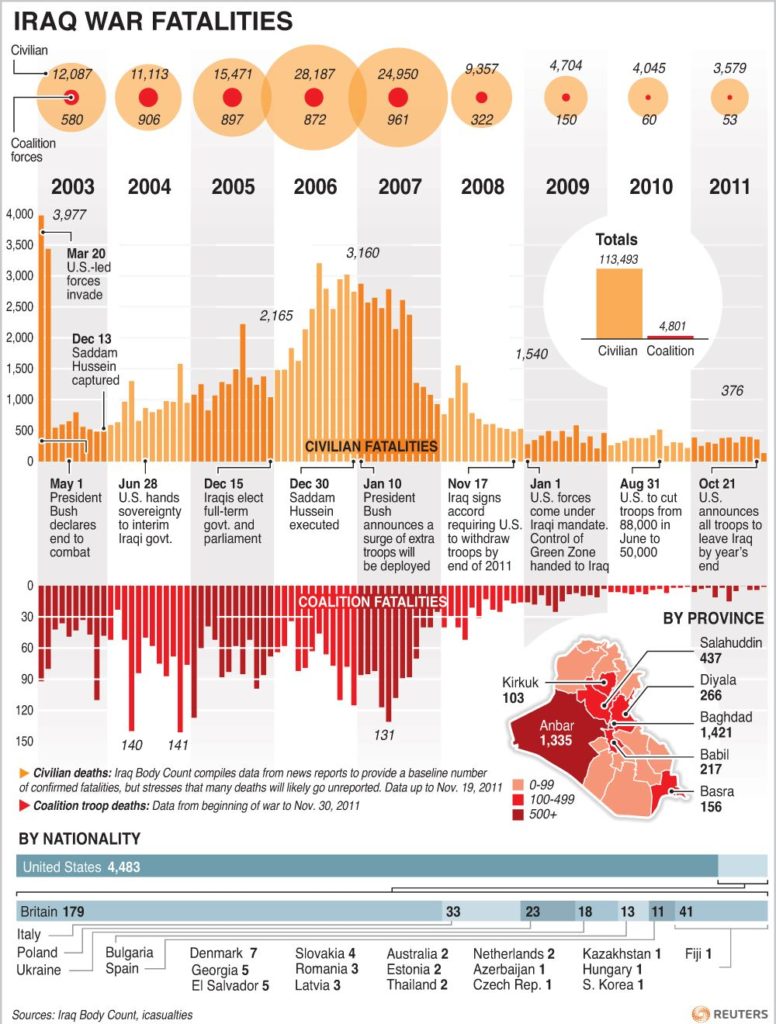
source: Reuters
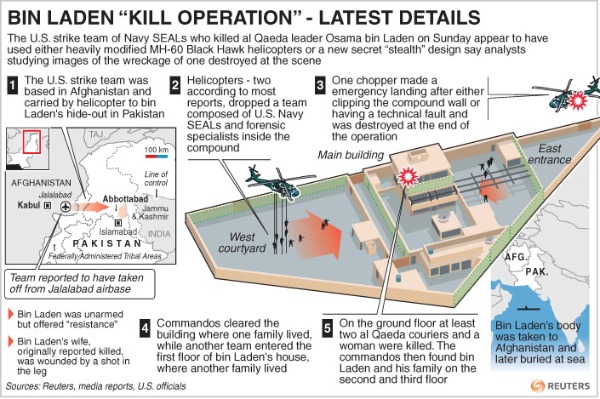
12. In May 2011 Osama Bin Laden was killed
Source: Reuters, The Atlantic
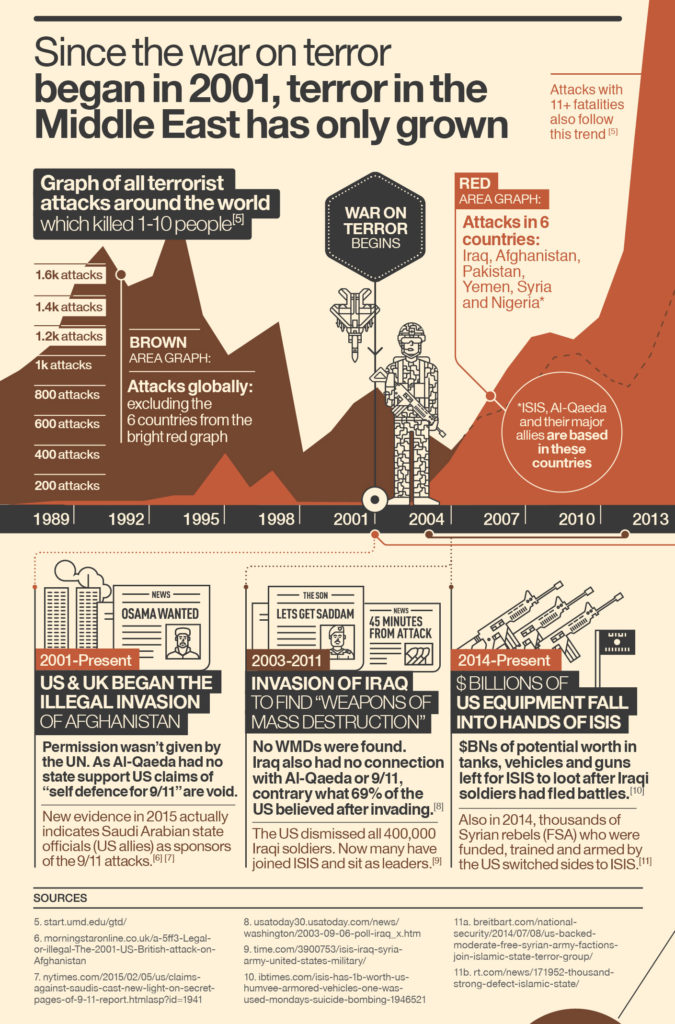
13. The war in Afghanistan and Iraq fueled the Islamic terrorist groups
The US invasion of Iraq was the ultimate acceleration of al-Qaeda’s strategy. It supercharged al-Qaeda’s recruiting and enabled the development of other terrorist groups including ISIS.
source: Behance
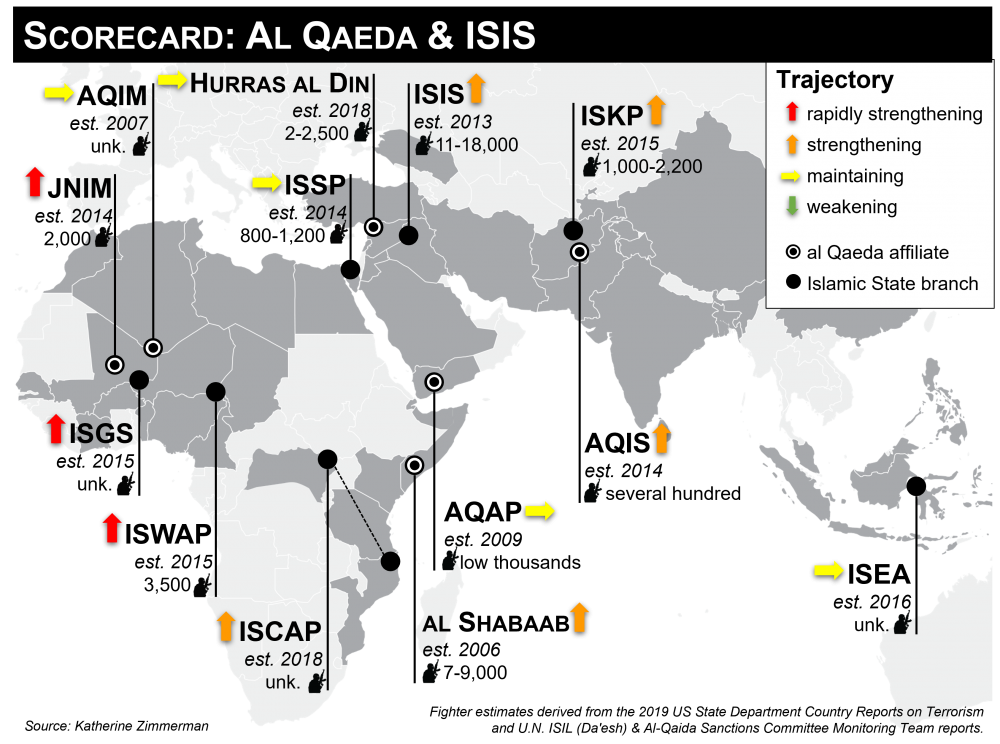
14. Al Qaeda & ISIS 20 Years After 9/11
Twenty years after the 9/11 attacks, the global jihadist movement has more fighters in more countries than ever before.
source: Wilson Centre
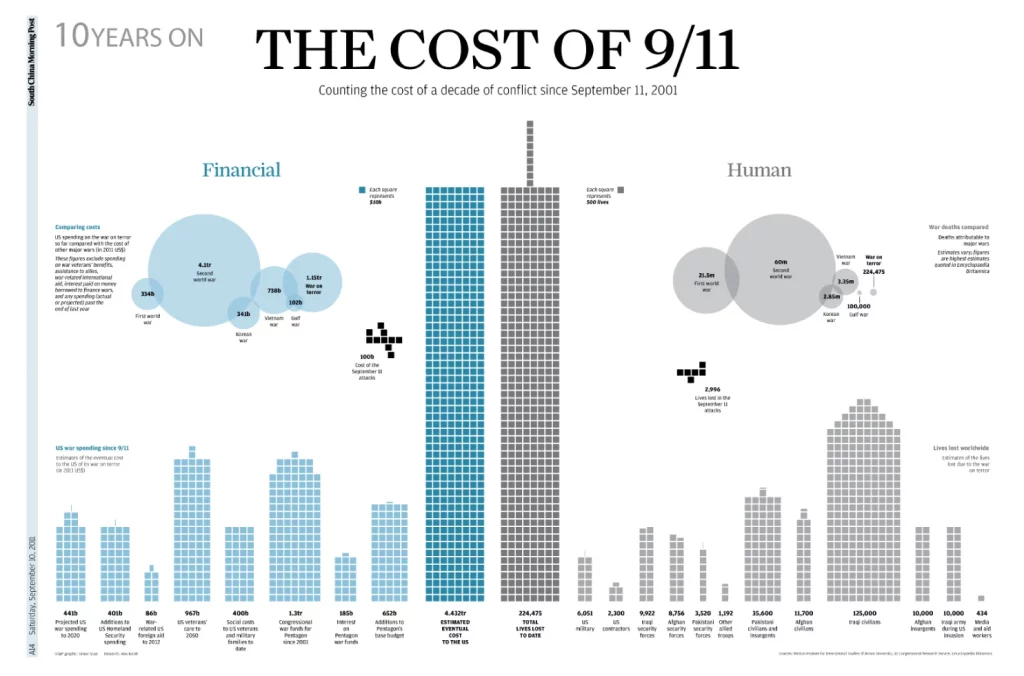
15. The cost of 9/11 (a decade later)
source: SCMP
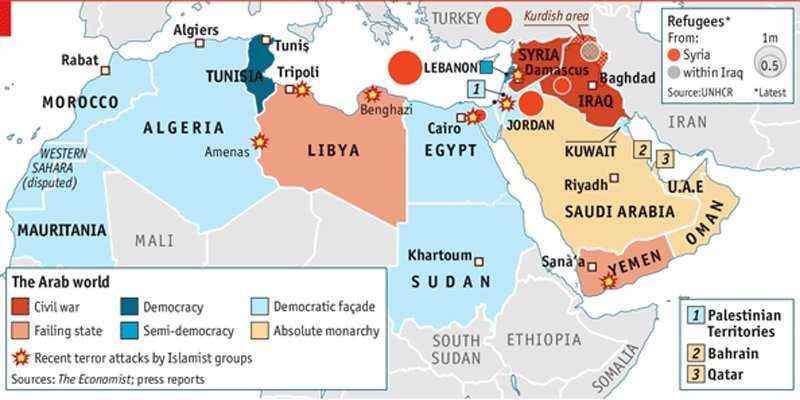
16. Instability and poverty in the region caused so-called Arab Spring
source: Business Insider
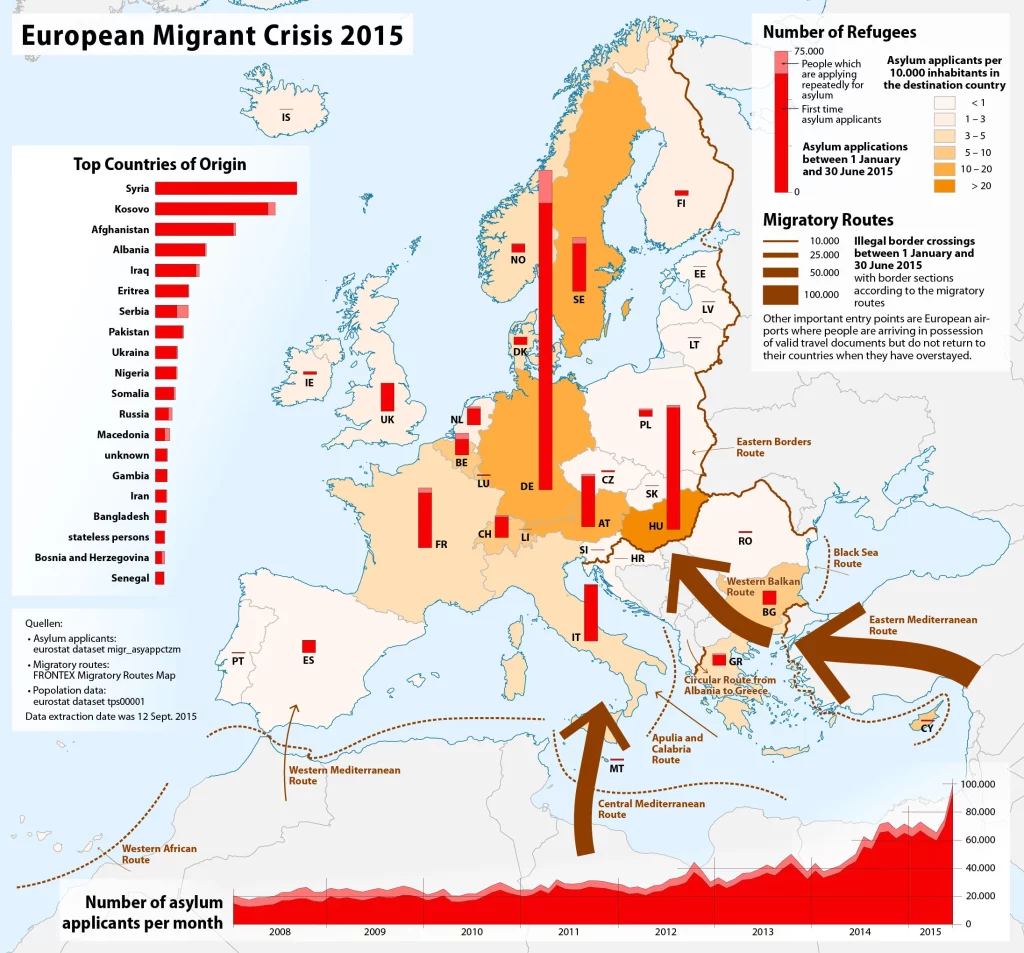
17. The Arab Spring caused a massive migration crisis in Europe
source: Wikipedia
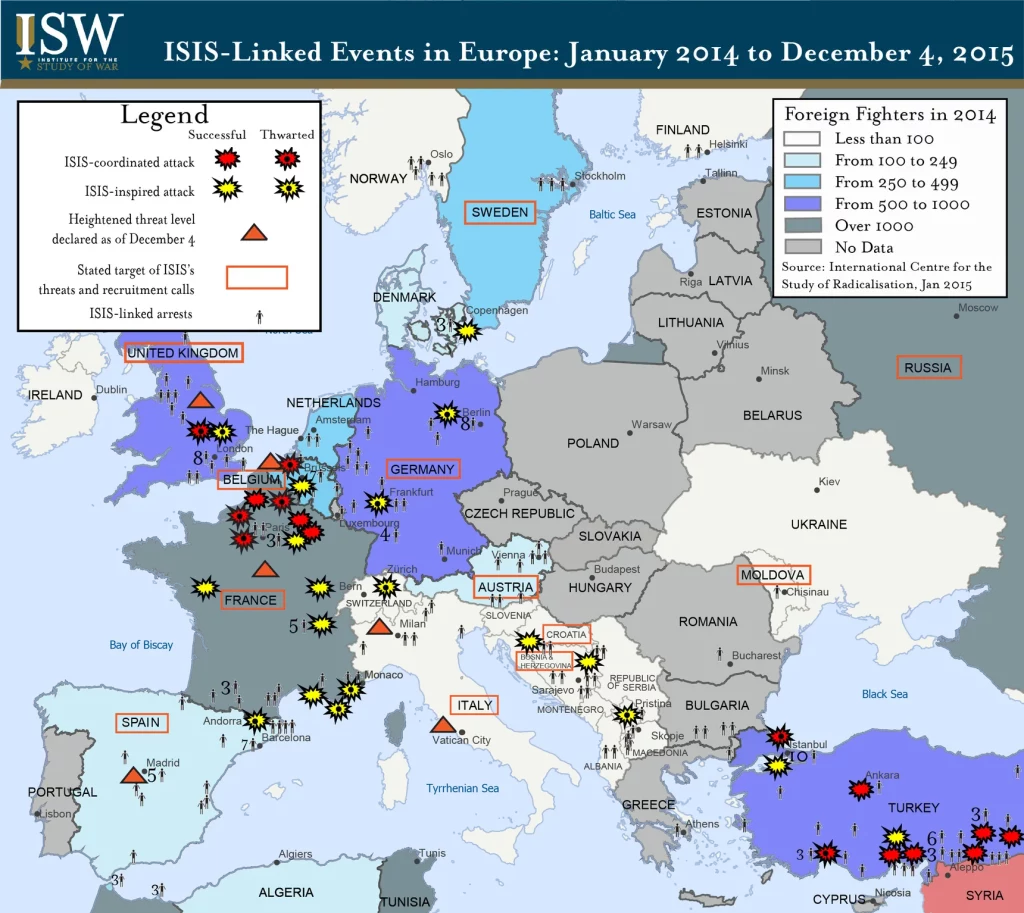
18. ISIS Linked Events in Europe between January 2014 and December 2015
source: ISW
19. Timelapse of terrorist attacks between 2000 and 2015
A time-lapse of all terrorist attacks with more than 20 fatalities between 1.12.2000 and 13.11.2015
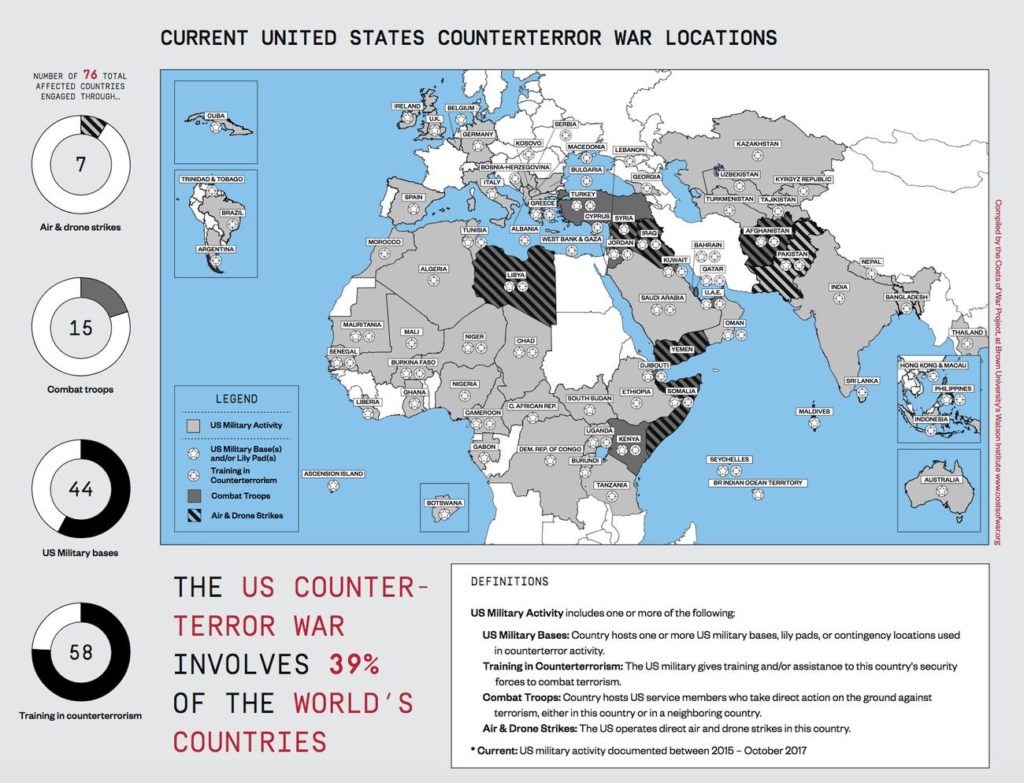
20. Between 2015 and 2017 US was fighting terrorism in 76 countries around the world
Between October 2015 and October 2017, the US fought terror in 76 countries or 39% of the total number of countries in the world.
Source: Business Insider
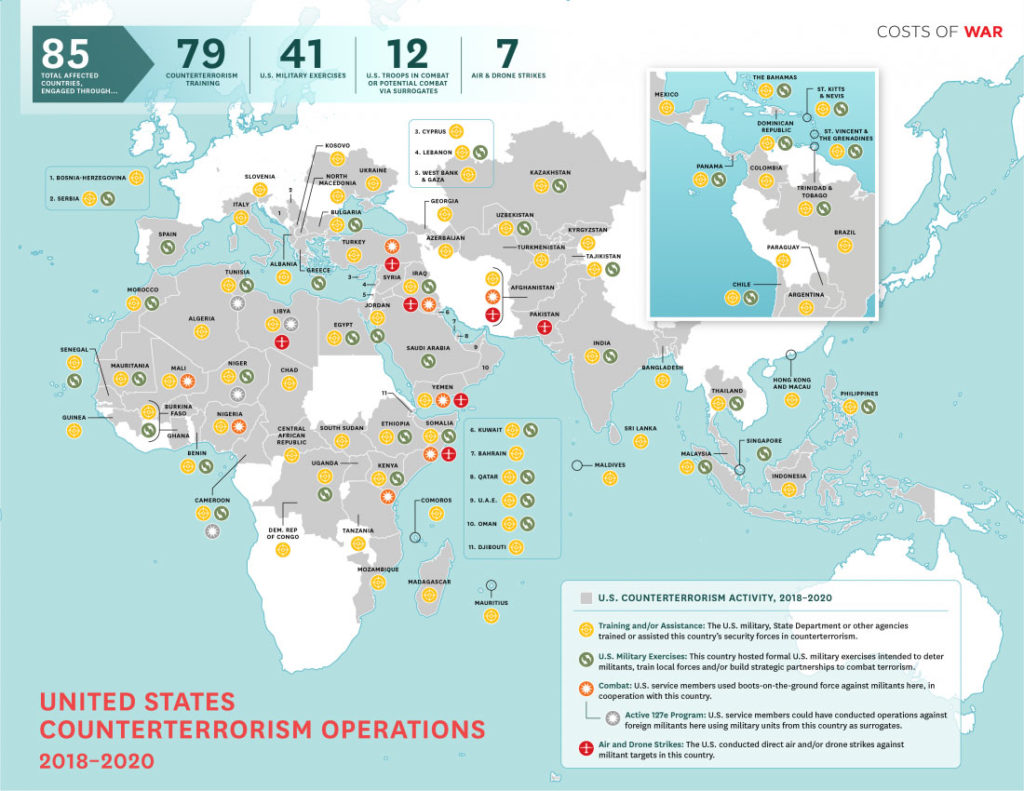
21. US counterterrorism operations 2018-2020
From 2018 to 2020, the United States government undertook what it labelled “counterterrorism” activities in 85 countries
source: Watson
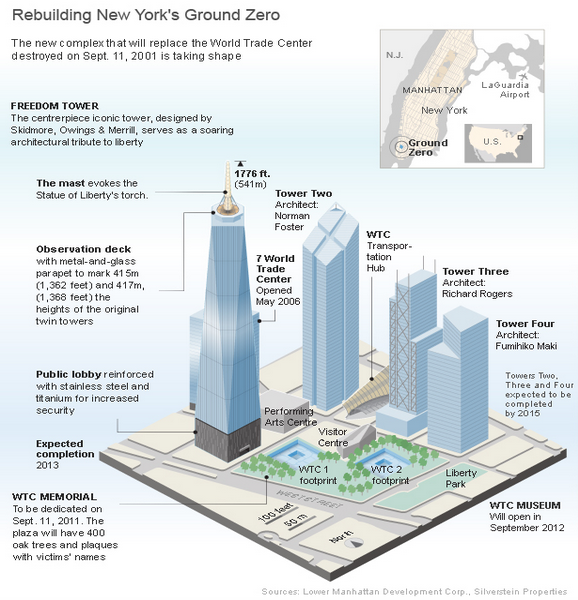
22. The reconstruction of the World Trade Centre and nearby buildings finished in 2018
source: B2C
23. Key facts about Afghanistan
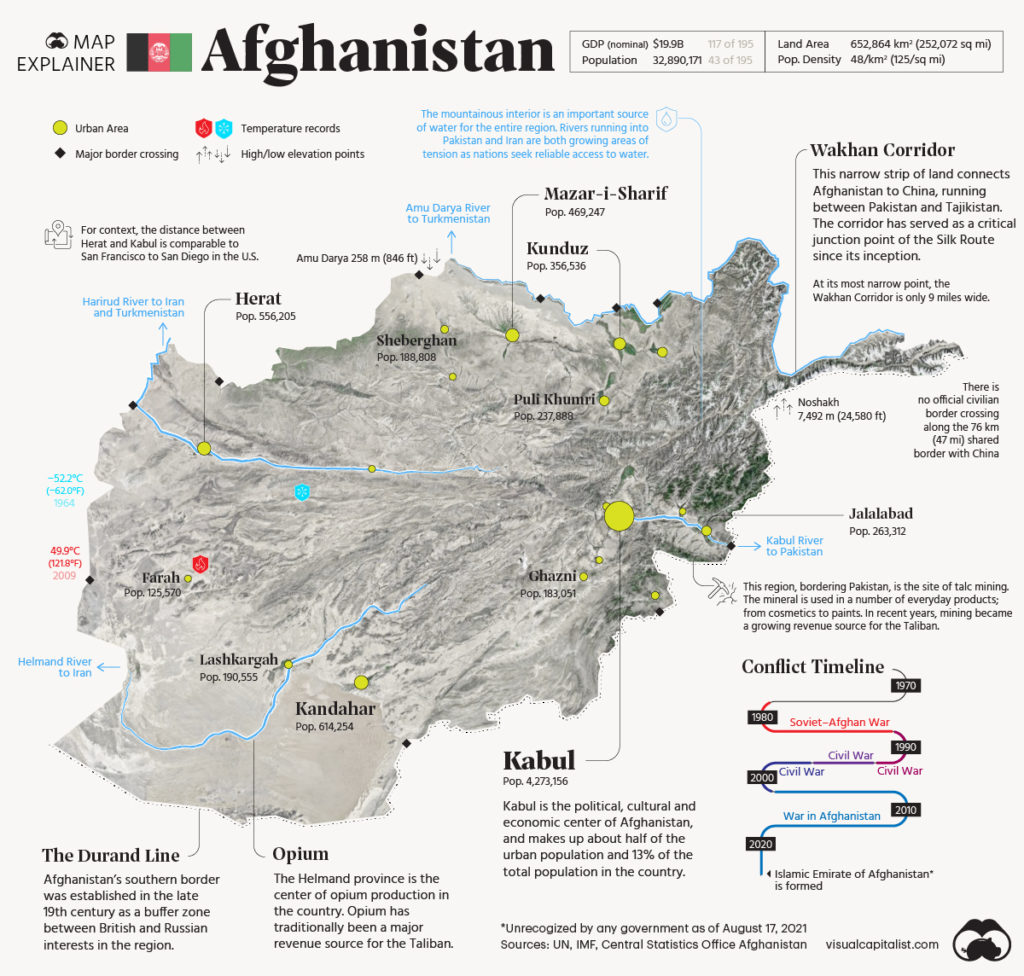
source: Visual Capitalist
24. How the Taliban expanded in Afghanistan between 2001 and 2021.
Did you like this post? Read more and subscribe to our monthly newsletter!


